Chapter 583 Diabetes Mellitus
583.1 Introduction and Classification
DM is not a single entity but rather a heterogeneous group of disorders in which there are distinct genetic patterns as well as other etiologic and pathophysiologic mechanisms that lead to impairment of glucose tolerance. A classification of diabetes and other categories of glucose intolerance is presented in Web Table 583-1. Three major forms of diabetes and several forms of carbohydrate intolerance are identified.
Web Table 583-1 ETIOLOGIC CLASSIFICATIONS OF DIABETES MELLITUS
* Patients with any form of diabetes may require insulin treatment at some stage of the disease. Such use of insulin does not, of itself, classify the patient.
Type 2 Diabetes Mellitus
The presentation of T2DM is typically more insidious than that with T1DM. In contrast to patients with T1DM who are usually ill at the time of diagnosis, children with T2DM often seek medical care because of excessive weight gain and fatigue as a result of insulin resistance and/or an incidental finding of glycosuria during routine physical examination. A history of polyuria and polydipsia is relatively uncommon in these patients. The incidence of T2DM in children has increased by more than 10-fold in many diabetes centers, in part as a result of the epidemic of childhood obesity (Chapter 44). Pediatric T2DM may account for as many as 30% of the new cases of diabetes, especially in obese African and Mexican-American adolescents. Acanthosis nigricans (dark pigmentation of skin creases/flexural areas), a sign of insulin resistance, is present in the majority of patients with T2DM and is accompanied by a relative hyperinsulinemia at the time of the diagnosis (Chapter 644). However, the serum insulin elevation is usually disproportionately lower than that of age-, weight-, and sex-matched nondiabetic children and adolescents, suggesting a state of insulin insufficiency. In some individuals, it may represent slowly evolving T1DM.
Other Specific Types of Secondary Diabetes
Web Table 583-2 details the current criteria for the diagnosis of DM. It should be noted that a fasting blood glucose that exceeds 125 mg/dL (6.9 mmol/L) is the accepted criterion for the diagnosis of diabetes.
Web Table 583-2 DIAGNOSTIC CRITERIA FOR IMPAIRED GLUCOSE TOLERANCE AND DIABETES MELLITUS
| IMPAIRED GLUCOSE TOLERANCE (IGT) | DIABETES MELLITUS (DM) |
|---|---|
| Fasting glucose 100-125 mg/dL (5.6-7.0 mmol/L) | Symptoms* of DM plus random plasma glucose ≥200 mg/dL (11.1 mmol/L) |
| or | |
| 2-hr plasma glucose during the OGTT ≥140 mg/dL, but <200 mg/dL 11.1 mmol/L) | Fasting plasma glucose ≥126 mg/dL (7.0 mmol/L) or 2-hr plasma glucose during the OGTT ≥200 mg/dL |
OGTT, oral glucose tolerance test.
* Symptoms include polyuria, polydipsia, and unexplained weight loss with glucosuria and ketonuria.
From Report of the Expert Committee on the Diagnosis and Classification of Diabetes Mellitus, Diabetes Care 20(Suppl 1):S5, 1999.
Impaired Glucose Tolerance
In the absence of pregnancy, IGT is not a clinical entity but rather a risk factor for future diabetes and cardiovascular disease. This may be observed as an intermediate stage in any of the disease processes listed in Web Table 583-1. IGT is often associated with the insulin resistance syndrome (also known as syndrome X or metabolic syndrome), which consists of insulin resistance, compensatory hyperinsulinemia to maintain glucose homeostasis, obesity (especially abdominal or visceral obesity), dyslipidemia of the high-triglyceride or low- or high-density lipoprotein type, or both, and hypertension (Chapter 44). Insulin resistance is directly involved in the pathogenesis of T2DM. IGT appears as a risk marker for this type of diabetes at least in part because of its correlation with insulin resistance. The diagnostic criteria for IGT are presented in Web Table 583-2.
583.2 Type 1 Diabetes Mellitus (Immune Mediated)
Epidemiology
T1DM accounts for about 10% of all diabetes, affecting 1.4 million in the USA and over 15 million in the world. While it accounts for most cases of diabetes in childhood, it is not limited to this age group; new cases continue to occur in adult life and approximately 50% of individuals with T1DM present as adults. The incidence of T1DM is highly variable among different ethnic groups. The overall age-adjusted incidence of type 1 DM varies from 0.7/100,000 per year in Karachi (Pakistan) to over 40/100,000 per year in Finland (Fig. 583-1). This represents a more than 400-fold variation in the incidence among 100 populations. The incidence of T1DM is increasing in most (but not all) populations and this increase appears to be most marked in populations where the incidence of autoimmune diseases was historically low. Data from Western European diabetes centers suggest that the annual rate of increase in T1DM incidence is 2-5%, whereas some central and eastern European countries demonstrate an even more rapid increase. The rate of increase is greatest among the youngest children. In the USA, the overall prevalence of diabetes among school-aged children is about 1.9/1,000, increasing from a prevalence of 1/1,430 children at 5 yr of age to 1/360 children at 16 yr. Among African Americans, the occurrence of T1DM is 30-60% of that seen in American whites. The annual incidence of new cases in the USA is about 14.9/100,000 of the child population. It is estimated that 30,000 new cases occur each year in the USA, affecting 1 in 300 children and as many as 1 in 100 adults during the lifespan. Rates are similar or higher in most Western European countries and significantly lower in Asia and Africa. But while incidence rates are much higher in European populations, the absolute number of new cases is almost equal in Asia and Europe because the population base is so much larger in Asia. Thus it is estimated that of the 400,000 total new cases of type 1 diabetes occurring annually in all children under age 14 yr in the world, about half are in Asia even though the incidence rates in that continent are much lower, because the total number of children in Asia is larger.
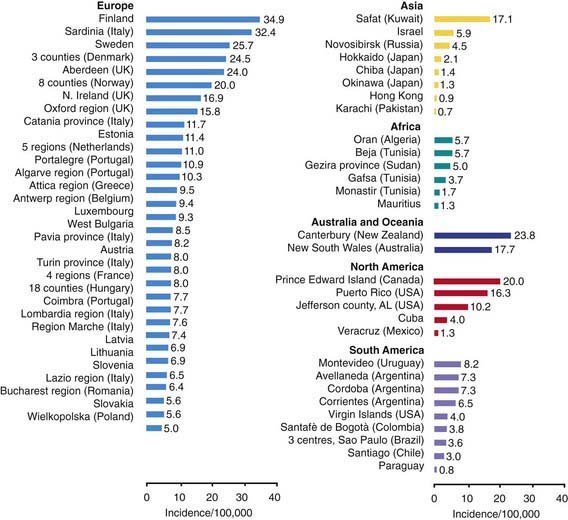
Figure 583-1 Incidence rates of type 1 diabetes mellitus by region and country.
(From Karvonen M, Viik-Kajander M, Moltchanova E, et al: Incidence of type I diabetes worldwide. Diabetes Mondiale (DiaMond) Project Group, Diabetes Care 23:1516–1526, 2000.)
Genetics
MHC/HLA Encoded Susceptibility to Type 1 Diabetes Mellitus
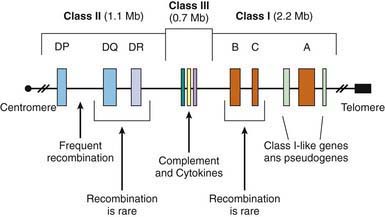
The MHC is a large genomic region that contains a number of genes related to immune system function in humans. These genes are further divided into HLA class I, II, III, and IV genes. Class II genes are the ones most strongly associated with risk of T1DM, but as genetic studies become more detailed it is becoming apparent that some of the risk associated with various HLA types is due to variation in genes in HLA classes other than class II. Overall, genetic variation in the HLA region can explain 40-50% of the genetic risk of T1DM (Fig 583-2).
Environmental Factors
Pathogenesis and Natural History of Type 1 Diabetes Mellitus
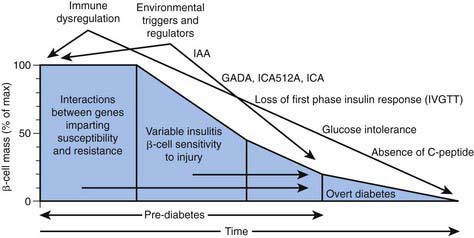
In type 1A diabetes mellitus, a genetically susceptible host develops autoimmunity against his or her own β cells. What triggers this autoimmune response remains unclear at this time. In some (but not all) patients, this autoimmune process results in progressive destruction of β cells until a critical mass of β cells is lost and insulin deficiency develops. Insulin deficiency in turn leads to the onset of clinical signs and symptoms of T1DM. At the time of diagnosis, some viable β cells are still present and these may produce enough insulin to lead to a partial remission of the disease (honeymoon period) but over time, almost all β cells are destroyed and the patient becomes totally dependent on exogenous insulin for survival (Fig. 583-3). Over time, some of these patients develop secondary complications of diabetes that appear to be related to how well-controlled the diabetes has been. Thus, the natural history of T1DM involves some or all of the following stages:
Initiation of Autoimmunity
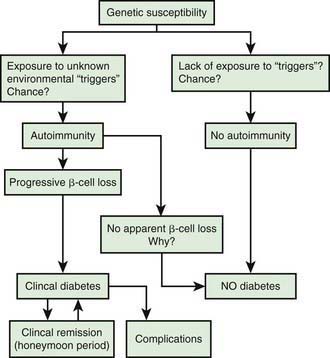
Genetic susceptibility to T1DM is determined by several genes (see section on genetics), with the largest contribution coming from variants in the HLA system. But it is important to keep in mind that even with the highest risk haplotypes, most carriers will NOT develop T1DM. Even in monozygotic twins, the concordance is 30-65%. A number of factors including prenatal influences, diet in infancy, viral infections, lack of exposure to certain infections, even psychologic stress, have been implicated in the pathogenesis of T1DM, but their exact role and the mechanism by which they trigger or aggravate autoimmunity remains uncertain (Fig. 583-4). What is clear is that markers of autoimmunity are much more prevalent than clinical T1DM, indicating that initiation of autoimmunity is a necessary but not a sufficient condition for T1DM. Whatever the triggering factor, it seems that in most cases of T1DM that are diagnosed in childhood, the onset of autoimmunity occurs very early in life. In a majority of the children diagnosed before age 10 yr, the 1st signs of autoimmunity appear before age 2 yr. Development of autoimmunity is associated with the appearance of several autoantibodies. Insulin associated antibodies (IAA) are usually the 1st to appear in young children, followed by glutamic acid decarboxylase 65 kd (GAD65) and tyrosine phosphatase insulinoma-associated 2 (IA-2) antibodies. The earliest antibodies are predominantly of the IgG1 subclass. Not only is there “spreading” of autoimmunity to more antigens (IAA, and then GAD 65 and IA-2) but there is also epitope spreading within 1 antigen. Initial GAD65 antibodies tend to be against the middle region or the carboxyl-terminal region, while amino-terminal antibodies usually appear later and are less common in children.
Preclinical Autoimmunity with Progressive Loss of β-Cell Function
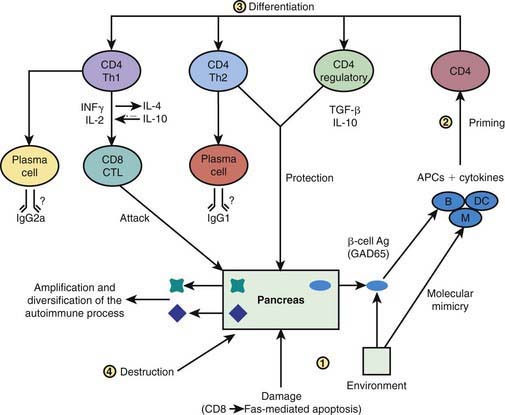
In some, but not all patients, the appearance of autoimmunity is followed by progressive destruction of β cells. Antibodies are a marker for the presence of autoimmunity, but the actual damage to the β cells is primarily T-cell mediated (Fig. 583-5). Histologic analysis of the pancreas from patients with recent-onset T1DM reveals insulitis, with an infiltration of the islets of Langerhans by mononuclear cells, including T and B lymphocytes, monocytes/macrophages, and natural killer (NK) cells. In the NOD mouse, a similar cellular infiltrate is followed by linear loss of β cells until they completely disappear. But it appears that the process in human T1DM is not necessarily linear and there may be an undulating downhill course in the development of T1DM.
Pathophysiology
Insulin performs a critical role in the storage and retrieval of cellular fuel. Its secretion in response to feeding is exquisitely modulated by the interplay of neural, hormonal, and substrate-related mechanisms to permit controlled disposition of ingested foodstuff as energy for immediate or future use. Insulin levels must be lowered to then mobilize stored energy during the fasted state. Thus, in normal metabolism, there are regular swings between the postprandial, high-insulin anabolic state and the fasted, low-insulin catabolic state that affect liver, muscle, and adipose tissue (Table 583-1). T1DM is a progressive low-insulin catabolic state in which feeding does not reverse but rather exaggerates these catabolic processes. With moderate insulinopenia, glucose utilization by muscle and fat decreases and postprandial hyperglycemia appears. At even lower insulin levels, the liver produces excessive glucose via glycogenolysis and gluconeogenesis, and fasting hyperglycemia begins. Hyperglycemia produces an osmotic diuresis (glycosuria) when the renal threshold is exceeded (180 mg/dL; 10 mmol/L). The resulting loss of calories and electrolytes, as well as the persistent dehydration, produce a physiologic stress with hypersecretion of stress hormones (epinephrine, cortisol, growth hormone, and glucagon). These hormones, in turn, contribute to the metabolic decompensation by further impairing insulin secretion (epinephrine), by antagonizing its action (epinephrine, cortisol, growth hormone), and by promoting glycogenolysis, gluconeogenesis, lipolysis, and ketogenesis (glucagon, epinephrine, growth hormone, and cortisol) while decreasing glucose utilization and glucose clearance (epinephrine, growth hormone, cortisol).
TABLE 583-1 INFLUENCE OF FEEDING (HIGH INSULIN) OR OF FASTING (LOW INSULIN) ON SOME METABOLIC PROCESSES IN LIVER, MUSCLE, AND ADIPOSE TISSUE*
| HIGH PLASMA INSULIN (POSTPRANDIAL STATE) | LOW PLASMA INSULIN (FASTED STATE) | |
|---|---|---|
| Liver | Glucose uptake | Glucose production |
| Glycogen synthesis | Glycogenolysis | |
| Absence of gluconeogenesis | Gluconeogenesis | |
| Lipogenesis | Absence of lipogenesis | |
| Absence of ketogenesis | Ketogenesis | |
| Muscle | Glucose uptake | Absence of glucose uptake |
| Glucose oxidation | Fatty acid and ketone oxidation | |
| Glycogen synthesis | Glycogenolysis | |
| Protein synthesis | Proteolysis and amino acid release | |
| Adipose tissue | Glucose uptake | Absence of glucose uptake |
| Lipid synthesis | Lipolysis and fatty acid release | |
| Triglyceride uptake | Absence of triglyceride uptake |
* Insulin is considered to be the major factor governing these metabolic processes. Diabetes mellitus may be viewed as a permanent low-insulin state that, untreated, results in exaggerated fasting.
Diagnosis
Diabetic Ketoacidosis
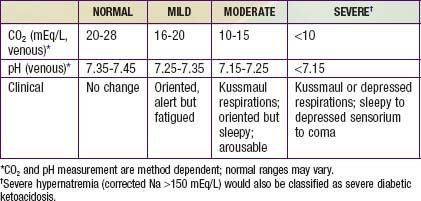
DKA is the end result of the metabolic abnormalities resulting from a severe deficiency of insulin or insulin effectiveness. The latter occurs during stress as counter-regulatory hormones block insulin action. DKA occurs in 20-40% of children with new-onset diabetes and in children with known diabetes who omit insulin doses or who do not successfully manage an intercurrent illness. DKA may be arbitrarily classified as mild, moderate, or severe (Table 583-2), and the range of symptoms depends on the depth of ketoacidosis. There is a large amount of ketonuria, an increased ion gap, a decreased serum bicarbonate (or total CO2) and pH, and an elevated effective serum osmolality, indicating hypertonic dehydration.
Treatment
Insulin Therapy
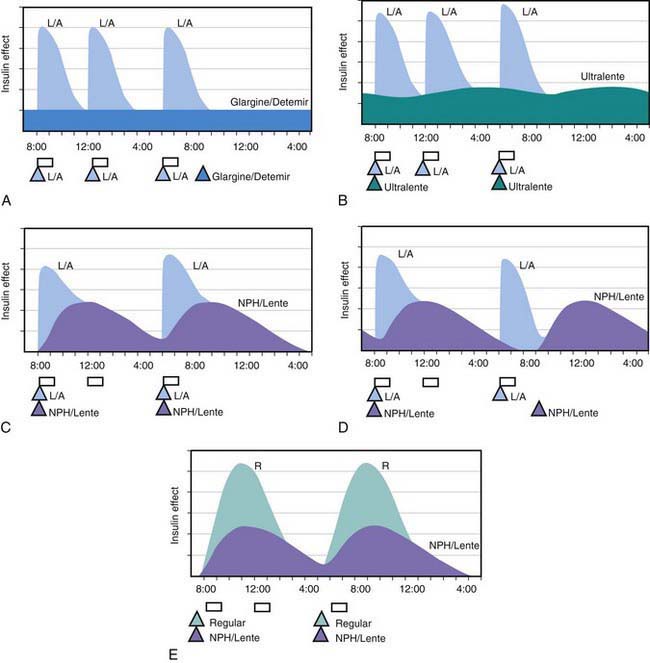
All preanalog insulins form hexamers, which must dissociate into monomers subcutaneously before being absorbed into the circulation. Thus, a detectable effect for regular (R) insulin is delayed by 30-60 min after injection. This, in turn, requires delaying the meal 30-60 min after the injection for optimal effect—a delay rarely attained in a busy child’s life. R has a wide peak and a long tail for bolus insulin (Figs. 583-6 and 583-7). This profile limits postprandial glucose control, produces prolonged peaks with excessive hypoglycemic effects between meals, and increases the risk of nighttime hypoglycemia. These unwanted between-meal effects often necessitate “feeding the insulin” with snacks and limiting the overall degree of blood glucose control. NPH and Lente insulins also have inherent limits because they do not create a peakless background insulin level (see Fig. 583-7C-E). This produces significant hypoglycemic effect during the midrange of their duration. Thus, it is often difficult to predict their interaction with fast-acting insulins. When R is combined with NPH or Lente (see Fig. 583-7E), the composite insulin profile poorly mimics normal endogenous insulin secretion. There are broad areas of excessive insulin effect alternating with insufficient effect throughout the day and night. Lente and Ultralente insulins have been discontinued and are no longer available.
Lispro (L) and aspart (A), insulin analogs, are absorbed much quicker because they do not form hexamers. They provide discrete pulses with little if any overlap and short tail effect. This allows better control of post-meal glucose increase and reduces between-meal or nighttime hypoglycemia (see Fig. 583-7A). The long-acting analog glargine (G) creates a much flatter 24-hr profile, making it easier to predict the combined effect of a rapid bolus (L or A) on top of the basal insulin, producing a more physiologic pattern of insulin effect (see Fig. 583-7A). Postprandial glucose elevations are better controlled, and between-meal and nighttime hypoglycemia are reduced.
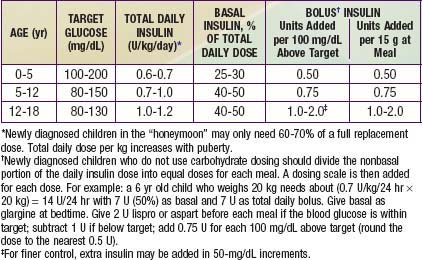
Ultralente (UL) given twice a day provided a reasonable basal profile (see Fig. 593-6C) and was quite effective when used with lispro or aspart (see Fig. 583-7B). Since UL is no longer available, G may be given every 12 hr in young children if a single daily dose of G does not produce complete 24-hr basal coverage. The basal insulin glargine should be 25-30% of the total dose in toddlers and 40-50% in older children. The remaining portion of the total daily dose is divided evenly as bolus injections for the 3 meals. A simple 3- or 4-step dosing schedule is begun based on the blood glucose level (Table 583-3). As soon as the family is taught to calculate the carbohydrate content of meals, bolus insulin can be more accurately dosed by both the carbohydrate content of the meal as well as the ambient glucose (see Table 583-3).
Ketoacidosis
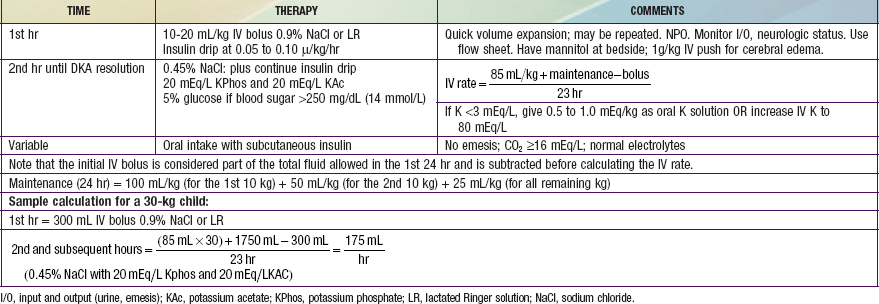
Reversal of DKA is associated with inherent risks that include hypoglycemia, hypokalemia, and cerebral edema. Any protocol must be used with caution and close monitoring of the patient. Adjustments based on sound medical judgment may be necessary for any given level of DKA (Table 583-4).
Table 583-4 DIABETIC KETOACIDOSIS (DKA) TREATMENT PROTOCOL
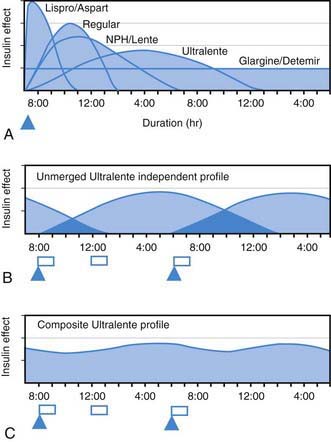
 , Injection time. B, Two Ultralente injections given at breakfast and supper. Note overlap of profiles. C, Composite curve showing approximate cumulative insulin effect for the 2 Ultralente injections. This composite view is much more useful to the patient, parents, and medical personnel because it shows important combined effects of multiple insulin injections with variable absorption characteristics and overlapping durations.