Background
Decorin, a leucine-rich proteoglycan that is produced by decidual cells, limits invasion and endovascular differentiation of extravillous trophoblast cells during early placentation by binding to multiple tyrosine kinase receptors, in particular, vascular endothelial growth factor receptor-2.
Objective
Because many studies have reported an association between poor trophoblast invasion and endovascular differentiation with preeclampsia, the studies reported here tested (1) whether decorin over-expression in the chorionic villi and/or basal decidua is associated with preeclampsia and, if so, (2) whether this association results in a hypoinvasive placenta, and (3) whether elevated plasma decorin concentration in the second trimester is a predictive biomarker for preeclampsia.
Study Design
Decorin messenger RNA expression was measured with quantitative polymerase chain reaction at the tissue level and with in situ hybridization at the cellular level using 35 S-labeled antisense complimentary RNA probe in placentas from healthy control subjects and subjects with preeclampsia (14 each, 23-40 weeks of gestation). Tissue sections of the same placentas were also immunostained for decorin protein. A decorin over-expressing human endometrial stromal cell line was tested for invasion-regulatory effects on an invasive first-trimester extravillous trophoblast cell line HTR-8/SVneo plated in cocultures that were separated by a semipermeable membrane. Furthermore, we conducted retrospective measurements of plasma decorin levels during the second trimester (15-18 weeks of gestation) in a cohort of 28 body mass index–matched pairs of control subjects and subjects with preeclampsia before the onset of clinical disease.
Results
First, decorin messenger RNA expression at the cellular level measured with in situ hybridization exhibited profoundly higher expression levels in basal plate decidual cells within the placentas from preeclamptic subjects than those from control subjects at all gestational ages, whereas no difference between the 2 subject groups was noted in villus mesenchymal cells. Similarly decorin messenger RNA expression at the tissue level in chorionic villi (primarily resulting from fetally derived mesenchymal cells) did not differ significantly between control and preeclampsia placentas. These findings were validated with immunostaining for decorin protein. Second, knocking down decorin gene in a decorin over-expressing endometrial cell line (used as an in vitro surrogate of decorin over-expressing decidual cells) in cocultures with extravillous trophoblast cells abrogated its invasion-restraining actions on trophoblast cells, which indicated paracrine contribution of decorin over-expressing decidua to the poor trophoblast invasiveness in situ. Finally, retrospective measurement of plasma decorin levels during the second trimester in 28 body mass index–matched pairs of control subjects and subjects with preeclampsia revealed elevated plasma decorin levels in all subjects with preeclampsia in all body mass index groups. A receiver operating characteristic curve analysis revealed strong diagnostic performance of plasma decorin in the prediction of preeclampsia status. Although there was no significant gestational age-related change in decorin levels during the second trimester in control or subjects with preeclampsia, we found that plasma decorin had a significant inverse relationship with body mass index or bodyweight.
Conclusion
We conclude that decorin over-expression by basal decidual cells is associated with hypoinvasive phenotype and poor endovascular differentiation of trophoblast cells in preeclampsia and that elevated plasma decorin concentration is a potential predictive biomarker for preeclampsia before the onset of clinical signs.
Preeclampsia is a serious pregnancy-associated ailment that afflicts approximately 8–9% of pregnancies in North America and 3–5% pregnancies globally. It is a leading contributor to maternal morbidity, death, and premature birth. It generally is accepted that preeclampsia is a multifactorial syndrome, with many of the causative factors being associated with a hypoinvasive placenta. The clinical signs typically are manifested as hypertension after the 20th week of pregnancy, in an otherwise normotensive mother, in association with proteinuria. Although conservative treatments can reduce the severity of disease, it cannot be cured without the delivery of the placenta, which indicates a placental origin of the disease. The disease typically is divided into 2 stages: an early stage (stage 1) of compromised trophoblast invasion and a later stage (stage 2) of maternal endothelial dysfunction, most likely the result of circulating toxic molecules that are released from a poorly perfused placenta. Stage 1 is insufficient to cause the maternal syndrome, but it interacts with maternal constitutional factors (genetic or environmental) to result in stage 2 disease. Molecules related to oxidative stress, inflammatory cytokines, and angiogenesis inhibitors have been identified in the maternal circulation, some of which have been related to maternal endothelial dysfunction and some of which have been proposed as biomarkers. A well-studied angiogenesis inhibitor, sFlt-1, has been identified as a predictive biomarker that is implicated in the pathogenesis of preeclampsia. However, sFlt-1 has been proposed recently instead as a protective mechanism in preeclampsia as a trophoblast-secreted response to vascular endothelial growth factor (VEGF) over-expression in the preeclampsia decidua. Further studies of molecules that are involved in the pathogenesis of preeclampsia are necessary to identify novel biomarkers for this multifactorial disease.
The hemochorial placenta, including the human, is a highly invasive structure, in which a trophoblast subpopulation, the extravillous trophoblast (EVT) invades the decidua and uteroplacental (spiral) arteries that feed the placenta. During arterial invasion, EVT cells adopt an endovascular phenotype to replace the endothelial lining of the arteries and modify them from narrow, high-resistance contractile vessels to wide, low-resistance and flaccid tubes that allow unhindered flow of maternal blood to the placenta. During normal placentation, the spiral arteries lose their smooth muscle coat within the endometrium and a portion of the myometrium. Poor EVT invasion and endovascular differentiation has been linked with an inadequate arterial modification that results in poor perfusion of the placenta with maternal blood. This, in turn, is believed to result in intrauterine growth restriction of the fetus and/or preeclampsia in the mother.
We and others have shown that, unlike tumor invasion, EVT invasion of the uterus is exquisitely regulated in situ, both positively and negatively, by a large number of locally produced molecules that include growth factors, growth factor binding proteins, proteoglycans, and lipid derivatives to maintain a healthy utero-lacental homeostasis. EVT cell proliferation, migration, and invasiveness were shown to be regulated negatively by 2 decidua-derived factors: transforming growth factor beta (TGFβ) and decorin, a secreted proteoglycan colocalized with TGFβ in the decidual extracellular matrix. The negative regulatory actions of decorin on EVT cells were shown to be mediated differentially by multiple tyrosine kinase receptors epidermal growth factor receptor, insulin-like growth factor receptor-1, and vascular endothelial growth factor receptor-2 (VEGFR)-2. We discovered that decorin is an antagonistic ligand for VEGFR-2 and that a 12 amino acid peptide within the leucine-rich-repeat 5 domain of decorin protein was responsible for the most avid VEGFR-2 binding, antagonizing VEGF actions on the EVT. We further showed that VEGF-A promoted endovascular differentiation of the EVT by binding to VEGFR-2, whereas decorin blocked the VEGFR-2–dependent endovascular differentiation of the EVT by blocking both ERK1/ERK2 and P38 MAPK pathways. We proposed that decorin over-expression or over-activity in the decidua may contribute to preeclampsia in the mother by a dual mechanism: decorin action on the EVT that leads to a hypoinvasive phenotype and decorin action on endothelial cells that inhibit angiogenesis.
We explored the following objectives: (1) whether decorin over-expression in the decidua in situ is associated with preeclampsia pregnancies; (2) whether this was causal in EVT hypoinvasiveness that was reported for preeclampsia placentas in situ, and (3) whether elevated decorin levels in the maternal plasma that was collected during the second trimester potentially could predict preeclampsia.
Materials and Methods
Placenta tissue collection
Placentas that were obtained from the tissue biobank of the Translational Research Centre of the Children’s Health Research Institute were collected at preterm or near-term deliveries at the Department of Obstetrics and Gynecology, University of Western Ontario. The institutional Research Ethics Board approved tissue collection and the study protocol. Table 1 presents the clinical characteristics of the control and preeclampsia placentas that were used for decorin messenger RNA (mRNA) quantification in chorionic villi at the tissue level by quantitative real-time polymerase chain reaction (qPCR), and at the cellular level by in situ hybridization (ISH). All subjects with preeclampsia met criteria based on International Society for the study of Hypertension in Pregnancy and The Society of Obstetricians and Gynaecologists of Canada diagnostic criteria for the disease. Subjects with any form of preexisting hypertension or proteinuria were excluded from the control group, and subject with diabetes mellitus were excluded from both groups. Preterm delivery occurred in control subjects for indications that included spontaneous preterm labor, preterm rupture of membranes, antepartum hemorrhage, or nonreassuring fetal monitoring in the absence of intrauterine growth restriction or preeclampsia.
| Variable | Control group (n = 14) | Preeclampsia group (n = 14) | P value (normal vs preeclampsia) b |
|---|---|---|---|
| Mean maternal age at delivery, y ± SD | 27.8 ± 7.0 | 27.5 ± 6.8 | >.05 |
| Mean gestational age at delivery, wk ± SD | 30.6 ± 5.3 | 31.3 ± 5.3 | >.05 |
| Systolic blood pressure, mm Hg ± SD | 124 ± 12 | 174 ± 17 | <.0000 |
| Diastolic blood pressure, mm Hg ± SD | 76 ± 8 | 108 ± 12 | <.0000 |
| Proteinuria (n ‘+’) c | 0.0 ± 0.0 | 3.3 ± 0.61 | <.0000 |
| Mode of birth: vaginal birth:low segment cesarean section | 9:5 | 7:7 | |
| Mean birthweight, g ± SD | 1707 ± 1028 | 1536 ± 984 | >.05 |
| Intrauterine growth restriction, n (%) | 0 | 3 (21.4) | |
| Fetal gender: male, n (%) | 10 (71.4) | 9 (64.3) |
a Additional subjects (2 control and 2 preeclamptic) included for quantitative real-time polymerase chain reaction alone had the following features, respectively: maternal age: 31 ± 1 years old, 30 ± 2 years old; gestational age: 28 ± 1 weeks, 27 ± 1 weeks; mode of birth: 0:2, 0:2; intrauterine growth restriction: 0,1
b Obtained by unpaired t -test
c Proteinuria as measured by number of ‘+’ on dipstick; –, +, ++, +++, ++++.
Freshly obtained placental tissues that included chorion and decidua were either frozen in liquid nitrogen (for qPCR) or immediately fixed in 10% formalin and then embedded in paraffin (for ISH). Frozen chorionic villus tissues from healthy control and preeclamptic pregnancies (n = 16 each) of matching gestational ages (23–40 weeks) were used to measure decorin expression by qPCR. For analysis, samples were ungrouped or grouped into early (23–27 weeks) or late (28–40 weeks) gestation, (n = 8 each). Fixed placental tissues inclusive of basal decidua from 14 control and 14 preeclamptic pregnancies were used for ISH of decorin mRNA, because 2 samples in each group mentioned earlier yielded insufficient tissue for further analysis. For ISH analysis, tissues were divided into 2 gestational age groups: 6 each in group 1 (23–27 weeks), and 8 each in group 2 (28–40 weeks). Tissues subjected to ISH were also used for immunohistochemistry to visualize decorin protein.
Decorin mRNA expression in the placenta using qPCR
Liquid nitrogen-frozen chorionic villi were crushed to powder form. The total RNA was isolated by Trizol-chloroform method, and qPCR was performed on a LightCycler (Bio-Rad Laboratories Inc, Mississauga, Ontario, Canada) with the use of custom-designed primers for human decorin (forward primer GACAACAACAAGCTTACCAGAGTA, reverse primer TGAAAAGACTCACACCCGAATAAG, product size: 163 base pair) and human β-actin (forward primer GAAATCGTGCGTGACATTAAGGAG, reverse primer ATGATGGAGTTGAAGGTAGTTTCG, product size: 230 base pair) with the use of the SYBR Green PCR mix (Quanta Bioscience, Gaithersburg, MD). The respective amplicon length was verified by running the PCR product on 1% agarose gel. ΔΔCt method was used to determine decorin mRNA expression relative to β-actin mRNA for each sample.
Decorin mRNA expression quantitated by ISH
Riboprobe preparation
We used the ISH protocol as reported earlier, with minor modifications. Human decorin transcript variant A1 DNA (gene bank ref ID: NM_001920.3 ) from a parent vector was used to amplify 1080 base pair of the decorin coding region. Forward and reverse primers for PCR sequencing with appropriate flanking restriction enzymes were designed respectively as 5′AAAGGTACCATGAAGGCCACTATCATCCTCC3′ and 5′GGCGTCTAGATTACTTATAGTTTCCGAGTTGAATGG 3′ (OligoPerfect designer; Life Technologies, Rockville, MD). The PCR products were gel-purified (Qiagen, Valencia, CA) and subcloned into pGEM-4Z (Promega Corp, Madison, WI) vector, that contained SP6 and T7 RNA polymerase promoters flanking the multiple cloning regions. The resulting subcloned plasmid product, pGEM4Z-decorin, was validated by running on 1% agarose gel and sequencing (London Genomic Centre, Robarts Research Institute, London, ON).
Transcription and radiolabeling of riboprobes
pGEM4Z-decorin was linearized at the appropriate digestion sites to produce the desired sense and anti-sense strands. SP6/T7 Riboprobe System- reagents and protocol (Promega Corp) was used for in vitro transcription of sense and anti-sense probes. Transcription and radiolabeling of 35 S –UTP (1200 Ci/mmol; Amersham SJ 1303; Amersham International PLC, Buckinghamshire, UK) were done in a single reaction of 10-μL reaction volume each for sense and anti-sense probes. Specific activity of probes was measured as the total incorporated 35 S counts per minute per microliter and stored at –80°C.
Tissue preparation for ISH
Sections (8 – μm thick) of fixed and paraffin-embedded placental tissues were deparaffinized, rehydrated, and, after prehybridization at 45°C, hybridized with 35 S -labeled anti-sense and sense complementary RNA probes (to the count of 10×10 6 cpm/mL of incorporated 35 S) overnight at 60°C and washed repeatedly with standard saline citrate solution of different strengths at different temperature, the final maximum stringency being 0.1×standard saline citrate at 60°C for 10 minutes.
Autoradiography
Sections were then dehydrated, coated with Kodak NTB nuclear track emulsion (Eastman Kodak Co, Rochester, NY) and exposed at 4°C for 7-14 days to assess labeling intensity. They were developed with D-19 developer (Eastman Kodak Co), fixed, stained with Harris’s hematoxylin and eosin, and mounted with Permount (Fisher Scientific, Pittsburgh, PA). Definitive analysis was done with slides that had been exposed for 14 days.
Image analysis
Complete image capturing and analysis was done at Integrated Microscopy (Biotron, University of Western Ontario) using Upright Zeiss AxioImager Z1 (Carl Zeiss Co, Jena, Germany). The analysts were blinded to the identification of the slides. To ensure crisp image capturing of all exposed silver grains in the emulsion above the hybridized cells, the “Stitch and Tile” and “Extended Depth of Focus” modules of the Zeiss’s Zen imaging software (Carl Zeiss Co) were used.
Quantification of grains
This was done in a blinded manner with the use of Image Pro Premier software (Media Cybernetics LP, Silver Spring, MD). Five sections (at 10 μm apart from each other) for each tissue were scanned for counting silver grains on all cells (identified by nuclear stain) in randomly selected fields of view (with a 100×100 μm grid) to derive the average number of silver grains per cell labeled with antisense (experimental) and sense (controls, providing the background labeling) probes.
Immunohistochemistry for cytokeratin7 (CK7) and decorin protein
To discriminate EVT cells from decidual cells in the basal plate and trophoblast cells lining the chorionic villi from the fetal mesenchymal cells within the villus core, randomly selected sections (n = 10) used for ISH were deparaffinized, subjected to antigen retrieval (by boiling for 10 minutes in citrate buffer [0.01 m , pH 6.0]) and immunostained with a CK7 monoclonal antibody (1: 250; Abcam, Toronto, Ontario, Canada). Tissue sections treated with immunoglobulin G of the same isotype in phosphate-buffered saline (PBS) in lieu of the primary antibody served as a negative control. To gather semiquantitative information on the expression of decorin protein at the cellular level, deparaffinized tissues were subjected to immunohistochemistry after antigen retrieval as mentioned earlier. The sections were washed for 10 minutes in 3% H 2 O 2 /PBS (2×5 min) and pretreated with avidin, followed by biotin (to block the remaining biotin binding sites on the avidin) followed by treatment with a universal blocking reagent (Background Sniper BS966; Biocare Medical, Concord, CA) for 10 minutes. Sections were then incubated with rabbit polyclonal anti–decorin antibody (ab67449; 1:250; Abcam) overnight at 4°C. Rabbit immunoglobulin G replacing primary antibody was used as negative control. PBS washes preceded all subsequent steps: incubation with biotinylated horse anti-rabbit secondary antibody (BA1100; Vector Laboratories, Burlington, ON) at 1:250 dilution for 30 minutes; streptavidin/peroxidase solution, avidin-biotin complex, in PBS (PK-4001; Vector Laboratories) for 45 minutes; DAB substrate, enhancer, and chromogen for 2 minutes, followed by counterstaining with methyl green.
EVT and human endometrial stromal cell (HESC) lines
To test whether decorin over-expression in the preeclampsia decidua is associated causally with hypoinvasive phenotype of EVT cells in situ, we used an in vitro system to measure invasiveness of first-trimester EVT cells in cocultures with a decorin over-expressing HESC line. The human EVT cell line HTR-8/SVneo was derived in our laboratory by SV40Tag immortalization of a short-lived primary first-trimester cell line HTR-8 that was produced from a chorionic villus explant in culture, as reported with methodologic details and phenotypes. The immortalized cell line was 100% positive for CK7 and expressed HLA-G, as verified recently. The cells express no measurable decorin. An immortalized HESC cell line, T-HESC, was obtained from the American Type Culture Collection, Rockville, MD (CRL-4003). These cells expressed a very high level of decorin mRNA, as revealed with qPCR. We knocked down decorin mRNA expression using small interfering RNA (siRNA) transfection (Santa Cruz Biotechnology Inc, Santa Cruz, CA), resulting in 76% knockdown (KD) of decorin mRNA (measured with qPCR), as compared with scramble siRNA. The decorin down-regulated cells were named as HESC-decorin-KD.
Invasion assays
Both control (scramble siRNA transfected) and HESC-decorin-KD cells were used as regulator cells in EVT (HTR-8/SVneo) cell invasion assays conducted in 24-well transwell inserts, as reported earlier for migration assays. The conditions for invasion assay were exactly the same as migration assay, except that the membranes were coated with a thin layer of growth factor reduced Matrigel so that the cells had to degrade the Matrigel barrier before migrating through the pores of the membranes. EVT cells at 70% confluency were serum starved overnight, and 60,000 cells in serum-free medium were plated onto the top chamber of the cell culture inserts. Fetal bovine serum (5%) was added to the lower chamber as stimulant. The bottom chambers contained no cell or control (scramble siRNA transfected) or HESC-decorin-KD cells at 1:1 and 1:2 responder (EVT)/regulatory (HESC) cell ratios. T-HESC cells were allowed to settle in the bottom chamber for 2 hours before the addition of EVT cells in the inserts of upper chambers. The assays were conducted for 48 hours at 37°C in 5% CO 2 , when the invasion reached a peak followed by a decline. The upper surfaces of the membranes were then wiped gently with cotton swabs to remove the cells that have not yet crossed the membranes. The membranes were then fixed with methanol, stained with 0.1% eosin, and counter-stained with methylene blue; the absolute number of invasive cells was scored visually with the use of a light microscope.
Expression of sFlt-1 in HTR-8/SVneo cells in the presence of exogenous decorin
To test whether decorin can regulate sFlt-1 expression by EVT cells, HTR-8/SVneo cells (10 5 cells per well in 6 well-plates), serum starved overnight were treated with bovine cartilage-derived decorin (200 nmol/L; Sigma-Aldrich, St. Louis, MO) for 6 hours and washed with PBS. RNA was isolated, and sFlt-1 mRNA levels were measured with qPCR in treated and untreated cells.
Measurement of plasma decorin levels in control subjects and subjects with preeclampsia by enzyme-linked immunosorbent assay (ELISA)
Selection of subjects used for plasma decorin measurements
A retrospective measurement of plasma decorin levels during the second trimester of pregnancy (15-18 weeks of gestation) was done in a cohort of control subjects and subjects with preeclampsia who were matched for body mass index (BMI) class. BMI was calculated with the formula: BMI= kg/m 2 . BMI classes were stratified as normal weight (BMI=18.5–24.9 kg/m 2 ), overweight (BMI=25.0–29.9 kg/m 2 ), and obese (BMI≥30.0 kg/m 2 ). Patient information was entered prospectively into a combined prenatal diagnosis, and perinatal database and second-trimester blood samples were retrieved from 28 women with preeclampsia and 28 BMI class-matched control subjects. Patients with preexisting hypertension, renal or autoimmune disease, diabetes mellitus, age <18 or >40 years, BMI<18 kg/m 2 , multiple pregnancies, and fetal congenital anomalies were excluded. The resulting dataset was found to be predominantly white; thus, non-white subjects were excluded to avoid any possible effect of race on circulating levels of decorin, as has been described with other placental markers. The study was approved by the University of Western Ontario Health Sciences Research Ethics Board (HSREB100348). At the time of sampling, none of the subjects had clinical features of preeclampsia. Plasma samples were stored at –80°C to measure a panel of putative biomarkers.
Decorin ELISA
Plasma decorin levels were measured with an ELISA kit from Sigma-Aldrich (RAB0140) using their protocol. This assay used anti-decorin capture antibody coated on a 96-well plate. Plasma samples were diluted to 1:500 in the diluents provided. Standards (recombinant human decorin provided in the kit) and samples were pipetted into the wells in duplicate, and the target protein present in a sample was bound to the wells by the immobilized antibody. The wells were washed, and a biotinylated anti-decorin antibody was added. After unbound biotinylated antibody was washed away, Horseradish peroxidase-conjugated streptavidin was pipetted to the wells. The wells were again washed, and 3,3’5,5′- tetramethylbenzidine substrate solution and subsequently Stop solution were added to the wells. Level of bound decorin protein, in proportion to the intensity of developed color was measured using the plate reader at 450 nm. With the optical density values obtained, the standard curve was plotted with the use of SigmaPlot software (SigmaStat, San Jose, CA), and the unknown concentrations in the samples were derived.
Statistical analysis
Data in this study are described as mean±SD or SEM as specified in the results and analyzed with the use of the GraphPad Prism statistical software (version 6; GraphPad Software, Inc, San Diego, CA) for most of the results. Unpaired 2-tailed t -test (with Welch’s corrections) was used for ISH data. Silver grain count distribution per cell as a measure of decorin mRNA by ISH revealed close to normal distribution so that mean grain counts were used for the final analyses. Linear regression was used for raw decorin values in plasma drawn at different gestational ages in control subjects and subjects with preeclampsia to identify any significant change over the period of gestation at sampling (15-20 weeks of gestation). The same was used to identify any significant relationship between plasma decorin values and subject BMI or bodyweight. For comparison of plasma decorin levels between control subjects and subjects with preeclampsia, either regardless of BMI values or stratified into BMI classes (normal weight, overweight, or obese), data were analyzed with 2-tailed Mann-Whitney test with the use of median and quartile distributions. To determine the predictive performance of decorin on preeclampsia status, control for BMI, or bodyweight, SPSS software (version 23; IBM Corporation, Armonk, NY) was used to conduct a logistic regression. Decorin, BMI, and bodyweight were entered as the predictors, and preeclampsia status was entered as the outcome. Finally, the diagnostic performance of plasma decorin in the prediction of preeclampsia status was estimated through a receiver operating characteristic (ROC) curve analysis. Probability values at <.05 were considered significant for all data.
Results
Clinical characteristics of control subjects and subjects with preeclampsia used for decorin mRNA expression in placentas
Clinical characteristics are summarized in Table 1 . Although 32 subjects (16 control and 16 preeclampsia) were used for qPCR quantitation of decorin mRNA at the tissue level in chorionic villi, with sufficient samples being unavailable from 4 subjects (2 control, 2 preeclampsia), this allowed for decorin mRNA measurements at the cellular level by ISH in 28 subjects (14 control, 14 preeclampsia).
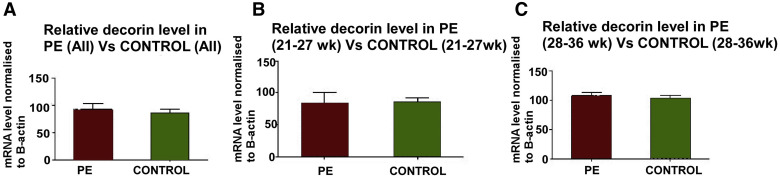
Decorin mRNA measured with qPCR in chorionic villous samples
The qPCR data for decorin mRNA were expressed relative to β-actin mRNA, which has been reported to be unchanged in preeclampsia placentas. Figure 1 presents the data in preeclampsia and healthy pregnancies (n=16 each) pooled for all gestational ages in Figure 1 , A, or grouped into early (<28 weeks) and late (≥28 weeks) gestation in Figures 1 , B and C, respectively. No significant difference was noted between preeclampsia and control placentas in any of the groups. Follow-up ISH studies were done to measure decorin mRNA at the cellular level in chorionic villi and basal plate decidua.
CK7 staining to distinguish trophoblast from mesenchymal and decidual cells in sections subjected to ISH
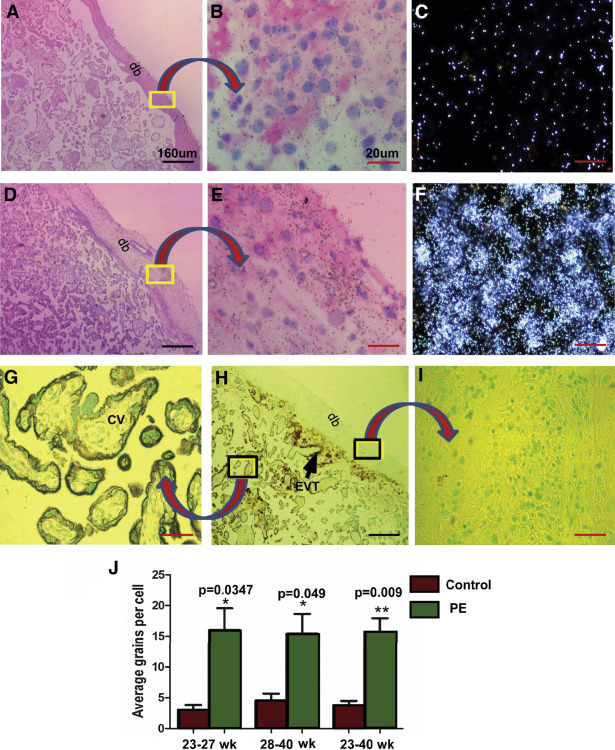
Figures 2 , G–I illustrate positive CK7 staining of trophoblast cells that were lining the chorionic villi and some EVT cells in superficial decidua basalis. As expected, neither decidual cells nor fetal mesenchymal cells were stained for CK7.
Quantification of silver grains in radio-autographs of sections counterstained with hematoxylin and eosin
Cell-specific expression of decorin mRNA was assessed by ISH with the use of 35 S-labeled antisense riboprobe; the background signal was provided by the sense riboprobe. Quantification of mRNA expression, given by the density of silver grains, was assessed by multiple fields of view of magnified images from both the groups in a blinded manner. Number of silver grains per cell above background provided the relative level of decorin mRNA expression. In the chorionic villi, decorin mRNA was expressed in chorionic mesenchymal cells and not in the villous trophoblast. In basal plate decidua, decorin mRNA was expressed in the decidual and not in the EVT cells. Decorin mRNA was observed in much greater abundance, as was revealed by the density of silver grains, in decidual cells of the basal plate decidua of preeclampsia placentas compared with controls ( Figure 2 , A–F). The mean grain counts per cell (±SE) presented either as gestation age groups (<28 or ≥28 weeks gestation) or ungrouped ( Figure 2 , J) demonstrate significant up-regulation of decorin mRNA in decidual cells of the basal plate decidua from preeclampsia patients compared with those in the same region of placentas from gestational age–matched control subjects.
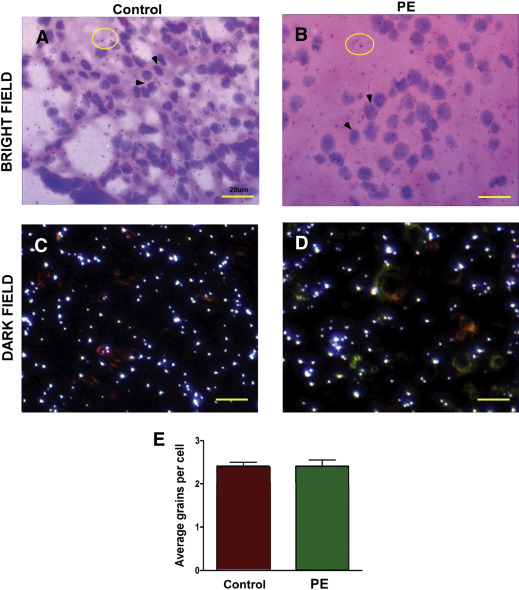
In contrast to decidual cells, there was no visible difference in decorin mRNA abundance (noted as low silver grain density above background) between the control and preeclampsia groups in corresponding chorionic villus mesenchymal cells ( Figures 3 ,A–D). Quantitation of silver grains in fetal mesenchymal cells did not show any differential expression of decorin mRNA between preeclampsia and control ( Figure 3 , E). This finding is consistent with the qPCR results presented earlier.
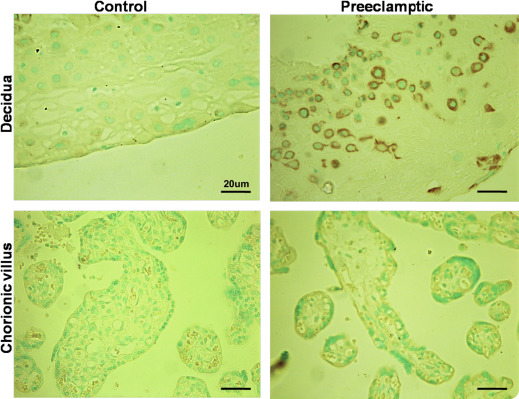
Comparison of decorin protein expression by immunohistochemistry
Immunohistochemically identified decorin protein was localized to the chorionic villus mesenchymal cells and decidual cells in placentas at all gestational ages in control subjects, as reported earlier. Consistent with the data on ISH mRNA expression presented earlier, decidual cells in the basal plate examined in 10 randomly selected sections, displayed much stronger immunostaining for decorin protein in preeclampsia placentas, whereas villus mesenchymal cells displayed equally weak immunostaining in both control and preeclampsia placentas. Representative pictures of control and preeclampsia placentas, both at 31 weeks gestation, are shown in Figure 4 .