Comparative Effectiveness Research in Gynecologic Oncology
LAURA J. HAVRILESKY  SHALINI L. KULASINGAM
  ELIZABETH L. JEWELL
  DAVID E. COHN
OVERVIEW OF COMPARATIVE EFFECTIVENESS RESEARCH
Introduction
Comparative effectiveness research (CER) is defined by the Institute of Medicine (IOM) as “the generation and synthesis of evidence that compares the benefits and harms of alternative methods to prevent, diagnose, treat, and monitor a clinical condition, or to improve the delivery of care.” With this definition, the IOM provides a framework for CER to exist, for example, in the development of a model to better understand the potential impact of an intervention (generation of evidence), or in the form of the comparison of 2 existing treatments of a condition (synthesis of evidence). As such, CER can take on various forms in differing clinical conditions.
The purpose of CER is “to assist consumers, clinicians, purchasers, and policy makers to make informed decisions that will improve health care at both the individual and population levels” (1). In an effort to develop meaningful results from CER studies, the IOM recognized that “the most important priority of all should be the building of a broad and supportive infrastructure to carry out a sustainable CER strategy.” Furthermore, the IOM was mandated by the Obama administration to both define and establish priorities for CER. According to the IOM’s definition, CER is a way to identify what works for which patients and under what circumstances. Congress, in the American Recovery and Reinvestment Act (ARRA) of 2009, appropriated $1.1 billion to jump-start the nation’s efforts to accelerate CER. Furthermore, ARRA created the Patient-Centered Outcomes Research Institute (PCORI), a public-private organization charged with setting national priorities for CER. In ARRA, IOM was also asked to recommend national priorities for research questions to be addressed by CER and supported by ARRA funds. The IOM provided its “100 Initial Priority Topics for Comparative Effectiveness Research,” which were then included in ARRA for priority funding (1). Many of these priorities are pertinent to gynecologic cancer research and are listed in Table 18.1. Although not comprehensive, this list provides insight into potential opportunities to utilize techniques and resources to study CER in gynecologic cancer. Despite the emphasis and funding to support CER, this field is not widely utilized in gynecologic cancer research, mainly due to the need for special understanding of the tools for performing and analyzing CER and a relative lack of understanding of the application of CER in gynecologic cancer practice. Nonetheless, the field of CER has been gaining momentum within the gynecologic cancer community and has resulted in impactful information that continues to move the field forward.
History of CER
The concept of comparing interventions based on best available data is not new. Over the last 50 years, the ability to deliver health care of high quality and value has continued to be a conceptual priority that has been variably named. In the 1970s, new health care technologies were evaluated through the U.S. Congress Office of Technology Assessment. In the 1980s and 1990s, the terms “Effectiveness Research” and “Outcomes Research” were commonly utilized when evaluating the quality of health care interventions, and were often associated with the Agency for Health Care Policy and Research (which eventually became more formally organized as the Agency for Healthcare Research and Quality [AHRQ], now charged with improving “the quality, safety, efficiency, and effectiveness of health care for all Americans”). Despite the changes in names and focus, the ultimate goal of these groups and initiatives was to provide data to support the rational development and utilization of health care interventions. The formal process of developing a CER focus was initiated in the 2003 Medicare Modernization Act, which appropriated $50 million to conduct research to address the needs and priorities related to improve outcomes, clinical effectiveness, and appropriateness of certain services and treatments. Data from these earlier efforts began to become integrated into coverage for these interventions in 2006, when the Centers for Medicare and Medicaid Services (CMS) provided support to the concept of inclusion of evidence-based decision-making and research into coverage determination policies. As the field has moved forward and become integrated into health care policy and coverage decisions, there has concurrently been an increasing concern that the field of CER will lead to rationing and denial of certain health care interventions. As the percentage of gross domestic policy spent on health care continues to rise beyond what is considered sustainable for the future, it is anticipated that CER will have a greater impact in establishing cost-effective and high-quality care.
Priority Topics for Comparative Effectiveness Research Pertinent to Gynecologic Cancer Research |
1. Compare the effectiveness of imaging technologies in diagnosing, staging, and monitoring patients with cancer, including positron emission tomography (PET), magnetic resonance imaging (MRI), and computed tomography (CT).
2. Compare the effectiveness of genetic and biomarker testing and usual care in preventing and treating ovarian cancer.
3. Compare the effectiveness of interventions (e.g., community-based multilevel interventions, simple health education, and usual care) to reduce health disparities in cancer.
4. Compare the effectiveness of different benefit design, utilization management, and cost-sharing strategies in improving health care access and quality in patients with cancer.
5. Compare the effectiveness of robotic assistance surgery and conventional surgery.
6. Compare the effectiveness of surgical resection, observation, or ablative techniques on disease-free and overall survival, tumor recurrence, quality of life, and toxicity in patients with liver metastases.
7. Compare the effectiveness of hospital-based palliative care and usual care on patient-reported outcomes and cost.
CER Methodology: “Real World” versus Randomized Controlled Trials
In practical terms, CER aims to compare 2 or more treatment strategies, either in clinical care or through modeling. This process of comparing strategies has historically been different from that of a conventional randomized controlled clinical trial (RCT), in which the subjects are carefully selected and many excluded from participation due to intercurrent illness or prior history. In CER, data is derived from “real world” subjects, settings, and treatments and is thus more apt to be generalizable to the overall population with a specific condition. Furthermore, RCTs tend to be of short duration and are underpowered to detect unexpected adverse effects or heterogeneity of treatment effects. Importantly, RCTs can be prohibitively expensive to complete and sometimes are not feasible to perform. While RCTs may be the best means by which one can assess whether an intervention works, it is an ineffective means to assess who will benefit from the intervention (2). CER methodologies often employ large clinical databases that are not restricted in their sample size, take into account those who do not participate in a research study, and are associated with a longer follow-up compared with RCTs. Given that these databases often have information regarding disease severity and subject comorbidity, a more complex analysis of the heterogeneity of treatment effects is feasible with database studies. Given the limitations of RCTs in the generalizability of an intervention and the strengths of CER in addressing this issue, there has been increasing interest in “pragmatic clinical trials,” which aim to combine the strengths of a RCT but are performed as larger population trials. These trials incorporate “real world” treatments, often include multiple outcomes, and are able to evaluate subgroup differences (3). It is anticipated that these trials will become increasingly important as the field of CER progresses.
CER and Cost-Effectiveness
While CER is broadly defined as any methodology that compares the benefits and harms of alternative strategies in health care, the most common CER studies fall within the field of health economics. Health economic studies address the optimal allocation of economic resources in health care. The most common type of health economic evaluation is a cost-effectiveness analysis (CEA), a tool for comparing the relative values of 2 or more medical interventions. Therefore, a CEA fits under the umbrella of CER through its ability to inform decision-making regarding the financial implications of health care.
Summary
Comparative effectiveness research is becoming increasingly utilized by patients, providers, purchasers, and policy makers to make informed decisions that will improve health care at both the individual and population levels. With increasing pressure to control the costs and improve the quality of health care, CER will be an important means by which different treatments can be critically evaluated. While in its relative infancy, CER in gynecologic cancer is a field ready for development.
PRINCIPLES OF HEALTH ECONOMIC ANALYSES
This section will introduce basic types of health economic studies. The term “cost-effectiveness analysis” is commonly used as a catchall term for any health economic analysis. In fact, there are several distinct forms of health economic evaluation, including CEA, cost-utility analysis (CUA), cost-minimization analysis (CMA), and cost-benefit analysis (CBA). CEA and CUA are the most frequently used health economic analyses. CEAs compare alternative interventions using a cost per unit of effectiveness such as a year of life gained (4). CUAs examine cost, effectiveness, and preferences for health outcomes. CMAs compare only cost. CBAs are less commonly used in health care and compare the total expected cost of each option against the total expected monetary benefit (4).
Cost-Effectiveness Analyses
CEA is defined by the United Kingdom’s National Institute for Health and Clinical Excellence (NICE) as an economic study design in which the consequences of different interventions are measured using a single outcome (e.g., years of life gained, deaths avoided) (5). A CEA is used to help prioritize the allocation of resources and to decide between one or more treatments or interventions. It compares a standard of care strategy to its more costly alternatives in terms of the additional cost per unit of effectiveness. Units of effectiveness in oncology CEA are most commonly expressed as additional survival time, but may be expressed in other terms such as the number of adverse events or additional procedures avoided or the number of cases of cancer prevented. This type of study is commonly used when a decision or health policy maker is operating within a given budget and is considering a limited range of options (4). When an intervention costs more and is also more effective than its alternative, the cost-effectiveness comparison is expressed as an incremental cost-effectiveness ratio (ICER) or the ratio of the difference in costs to the difference in effectiveness between 2 strategies.
Cost-Minimization Analyses
In some cases, alternative medical decisions have approximately equivalent effectiveness but potentially different costs. In such cases, the effectiveness component of a CEA may not be needed. CMAs assume comparable effectiveness between strategies and choose a preferred strategy based on the mean cost of each (6). For example, a recent decision analysis comparing the costs of three different surgical approaches to endometrial cancer staging assumed equal survival outcomes between strategies and therefore did not incorporate effectiveness (7).
Cost-Utility Analyses
CUA is a form of CEA in which effectiveness is adjusted based on the quality of life that is associated with each strategy. In CUAs, utilities are the measurement used for quality of life and represent the preferences of an individual or a society for a particular health outcome. A utility is a number between 0 and 1, with 1 representing perfect health and 0 representing death. The most common metric used for comparison of strategies in a CUA is a quality-adjusted life year (QALY). The QALY quantifies both differences in survival and in quality of life between strategies. In an oncology CUA, the QALY is usually derived as the product of the length of survival in a specific health state and the utility representing the quality of life in that state. For example, 1 year of additional survival in a health state of utility 0.8 is equivalent to 0.8 QALYs. CUAs are preferred when both morbidity and mortality are affected by the proposed medical intervention or when quality of life related to the intervention being examined is a major concern. QALYs are the recommended outcome for health economic analyses if utility scores are available (8).
Cost-Benefit Analyses
CBA is a more global type of economic analysis than CEA and CUA in that it can be used to evaluate programs outside the realm of health care, such as general public policy decisions. A CBA measures both the costs and the consequences of each intervention in monetary units. The outcome of a CBA can be expressed as a ratio of benefits to costs. Unlike CEA and CUA, which define costs and effects by comparing at least two strategies and choosing one as the winner, a CBA estimates the absolute monetary benefit of a proposed health care intervention or program. A key characteristic of a CBA performed in the field of health care is the need to assign monetary values to health outcomes. Such an exercise is considered controversial by some due to the placement of monetary value on human life (4).
Methods for Development of a Health Economic Decision Model
This section will address specific methods used in the development of a health economic decision model, with an emphasis on the two most common types of models, CEA and CUA.
Define the model’s perspective The perspective of a health economic model is the first important consideration as costs are calculated differently based on the perspective taken. Most CEAs are performed from a third-party payer or a societal perspective. In a third-party payer perspective model, costs assumed by an insurance company or by Medicare are incorporated. These may include professional fees for encounters and procedures, reimbursements to the hospital or ambulatory surgical center for postoperative care, or reimbursements for home health or rehabilitation care. A societal perspective is usually most appropriate as it accounts not only for all costs included from a third-party payer perspective, but also costs related to a patient’s lost productivity and the caregiver’s expense. For example, if one surgical approach results in a faster return to work, this will be associated with less cost that is due to lost productivity. Use of the societal perspective has led to the recognition that minimally invasive surgery results in cost savings to society (7,9,10). Other perspectives of health economic models include the patient and hospital perspectives. A hospital perspective model might be used to inform the decision to purchase expensive equipment such as robotic surgery platforms or an intraoperative radiotherapy facility.
Define the question Once the model’s perspective has been determined, the clinical problem, standard approach, and any alternatives must be defined (11). The alternatives to the intervention of interest should always include a standard of care approach or even a “do nothing” approach. Next, a conceptual model for the analysis is developed, which outlines the possible consequences of each intervention. Decision models are often used as the conceptual framework for CEAs and have become an integral part of CEA studies.
Develop a decision tree A simple decision tree begins with a decision node representing the primary clinical decision being examined. Two or more strategies may be examined using one decision tree. The subsequent nodes in the tree are termed chance nodes, and define the probability of each possible clinical event that follows from the initial decision. For example, if the decision node concerns the clinical question of whether to accept a blood transfusion, the first chance node may define the probability that the patient will be infected with a blood-borne infection such as HIV if she accepts. Another chance node may define the risk of death if transfusion is refused (Fig. 18.1). Probabilities defined at chance nodes are usually derived from the literature or from clinical trial data. At the end of each branch of a decision tree is the terminal node, at which a payoff representing the effectiveness of that strategy occurs. In the blood transfusion example, the terminal nodes define 3 states: Life, death, or life with a blood-borne infection such as HIV. The payoff for life is 1, for death is 0, and for infection is a utility representing a lifetime spent with the infection. The expected value of each strategy, or its effectiveness, is calculated as the weighted average of the probabilities and payoffs associated with each terminal branch of the tree. The strategy resulting in the highest expected value is said to be the most effective. The payoff in an oncology model is usually expressed as a survival time. In a CUA, the effectiveness might be the product of survival time and the quality of life-based preference score, or utility.
Once all possible clinical events and their probabilities and payoffs have been defined by chance nodes, the costs of tests, treatments, and adverse events may be incorporated at each node. The cost associated with each strategy is calculated as a weighted average of the costs and probabilities associated with each branch of the tree.
Analysis of model After cost and effectiveness information have been collected and incorporated into the model, the analysis is performed. Results of cost-effectiveness models are expressed in terms of a comparison of 2 or more strategies. When one strategy is both more costly and less effective than an alternative strategy, it is said to be dominated and should not be considered. Likewise, a strategy that is both more effective and less costly is considered to be dominant and should be the treatment of choice. In these 2 cases, numeric cost-effectiveness quantification is not needed. When one strategy is both more costly and more effective than an alternative, an ICER is calculated. This is expressed as the difference in the mean cost divided by the difference in the mean effectiveness between strategies.
The ICER for comparison of intervention A compared to intervention B is defined as:
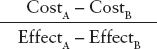
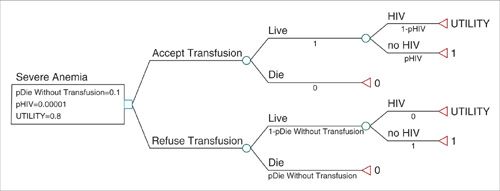
FIGURE 18.1. Simple decision tree representing the choice to accept or refuse a blood transfusion for severe anemia. The blue square is the decision node, green circles are chance nodes, and the red triangles are terminal nodes. Probabilities of events are depicted beneath each branch. Payoffs are listed to the right of terminal nodes. Three parameters are modeled as variables and have been given numeric values defined beneath the decision node. pHIV is the probability of being infected with HIV should the patient accept a transfusion. pDieWithoutTransfusion is the probability of death from severe anemia without a transfusion. Utility is the quality-of-life-related value of living with HIV, where 0 represents death and 1, perfect health.
It is important to note that the ICER is not estimated by dividing the cost of one intervention by the measure of its own effectiveness. This average cost-effectiveness ratio is not comparable to the ICER and is not a useful metric in cost-effectiveness analyses (12).
In the United States, an intervention has traditionally been considered cost-effective relative to an alternative strategy if the ICER is less than $50,000 per quality-adjusted life year (QALY) (6). While ICER thresholds of $50,000 per QALY are theoretically used in decision making, they are not strictly applied. Social norms may raise this value such that interventions costing up to $100,000 or even greater per QALY have sometimes been considered cost-effective (13). The term “cost-effective” does not mean that a strategy saves money but rather that the additional cost of the intervention is worthwhile, usually from the perspective of society.
Sensitivity Analyses
Uncertainty in health economic analyses may exist about such input parameters as cost, survival, or clinical probabilities. To assess the impact of such uncertainty on the findings of a decision model, a sensitivity analysis can be performed. The simplest form of sensitivity analysis is a one-way analysis. Estimates are varied one parameter at a time to evaluate the impact made by the changes on the outcome or conclusions of the model (14). For example, in the simple model describing the decision to accept or refuse a blood transfusion, varying the probability of death due to anemia or the utility related to quality of life with HIV has an impact on the expected value of each decision (Fig. 18.2A–B). Likewise, a two-way sensitivity analysis can be performed to evaluate the impact of varying two model parameters simultaneously (Fig. 18.2C). When variation in the key parameters of a model over their confidence intervals or expected range of values does not change the model’s results, the model is said to be insensitive to these variations and its conclusions can be more strongly interpreted. Models whose outcomes change significantly when key estimates are varied over a clinically reasonable range should be interpreted with caution.
Most clinical models are fairly complex and may warrant the use of multiple simultaneous sensitivity analyses. In a Monte Carlo probabilistic sensitivity analysis, each variable in the model can be sampled from a probability distribution representing its value (15). Sampling parameter values from probability distributions (rather than from a simple range of values) places greater weight on likely combinations of parameter values. Multiple sampling simulations of the model may then be run, each of which results in an individual cost-effectiveness comparison or estimate. Multiple simulations allow for construction of a cost-effectiveness scatterplot and the ability to express confidence intervals around the ICER estimate (Fig. 18.3), which effectively allows quantification of the total impact of uncertainty on the model and the confidence that can be placed in the analysis results.
INPUT DEVELOPMENT FOR HEALTH ECONOMIC MODELS
The following section details methods for the development of input data for health economic models.
Estimation of Costs
Cost definitions The costs incorporated into a CEA depend on the study’s perspective. The standard CEA or CUA is performed from a societal perspective (6). However, alternative perspectives include those of the patient, hospital, or a third-party payer. In a societal perspective analysis, the costs included are all of those borne by society and should therefore include both direct and indirect costs. Direct costs include direct medical costs (e.g., professional and hospital costs, diagnostic tests and procedures) and direct nonmedical costs (such as travel to receive care). Indirect costs account for lost productivity due to time off work for illness, both for the patient and any caregivers. When a health economic model is performed from a non-societal perspective, the scope of the costs included may be narrower. For example, in an analysis performed from a third-party payer perspective, lost productivity would not be included.
Which costs to include When developing a model to compare two strategies, it is important to remember that all medical costs do not necessarily need to be incorporated if it can reasonably be assumed that they do not differ between strategies. For example, for a comparison of 2 alternative surgical approaches to a disease, the cost of identical preoperative evaluation and laboratory testing need not be incorporated. Likewise, for a cost comparison of a Phase III clinical trial, the costs and consequences of adverse events that do not differ significantly between treatment arms may be omitted. Conversely, if there are global downstream effects on health care costs that result from an intervention, such as fewer subsequent hospitalizations or emergency department visits, these should be incorporated.
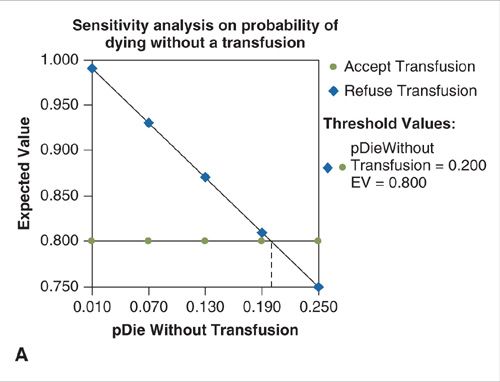
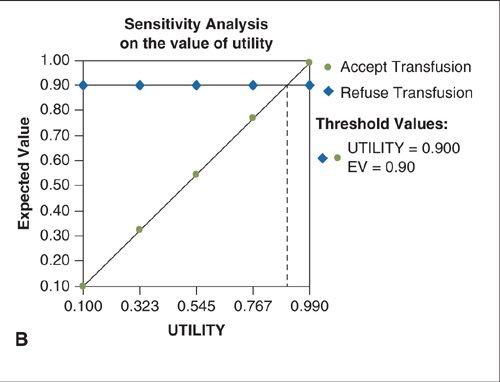
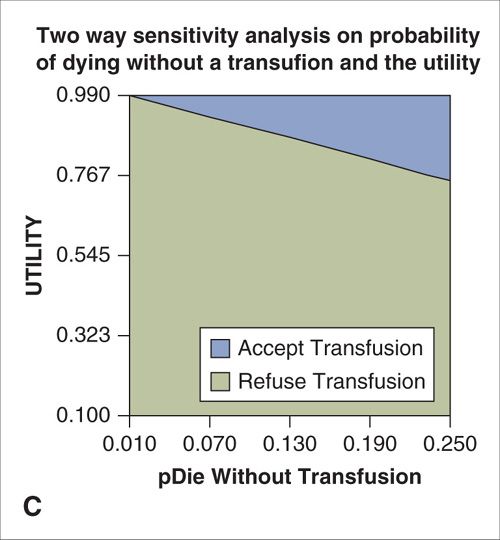
FIGURE 18.2. A. One-way sensitivity analysis on the probability of death from anemia without a blood transfusion. When the probability of death from anemia exceeds the threshold value of 0.2, the expected value (EV) of accepting the transfusion exceeds that of refusing transfusion and the correct choice is to accept the transfusion. B. One-way sensitivity analysis on the quality-of-life-related utility of living with HIV. When the utility exceeds the threshold value of 0.9, the expected value (EV) of accepting the transfusion exceeds that of refusing transfusion and the correct choice is to accept the transfusion. C. Two-way sensitivity analysis in which the utility associated with HIV infection and the probability of death without transfusion are varied simultaneously. The blue shaded area represents values for which acceptance of a transfusion results in the highest expected value (payoff) and is the preferred choice. Green shaded area represents combinations for which refusal of transfusion is the preferred choice.
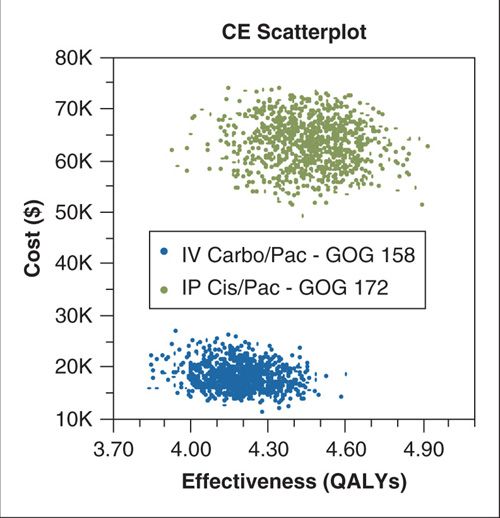
FIGURE 18.3. Cost-effectiveness scatterplot resulting from a Monte Carlo probabilistic sensitivity analysis for a model comparing intravenous carboplatin/paclitaxel to intraperitoneal cisplatin/paclitaxel and intravenous paclitaxel for advanced ovarian cancer. The simulation was repeated 10,000 times with sampling of key model parameters (cost, survival, and probability of adverse events) from probability distributions. This simulation resulted in an estimate of 95% confidence intervals to surround the primary incremental cost-effectiveness ratio estimate.
Source: Reprinted with permission from Havrilesky LJ, Alvarez-Secord A, Darcy KM, et al.
Cost effectiveness of intraperitoneal compared with intravenous chemotherapy for women with optimally resected stage III ovarian cancer: a Gynecologic Oncology Group study. J Clin Oncol. 2008;26(25):4144–4150. (114)
Abbreviation: CE, cost-effectiveness; QALY, quality-adjusted life year.
Costs versus charges When performing a health economic analysis, it is important to distinguish costs from charges. Charges represent what the provider or hospital asks an individual to pay for a service, and not the reimbursement provided by either a private third-party payer or Medicare. Because reimbursements by the CMS are generally considered to approximate the cost of providing a service, it is standard to use national Medicare reimbursements to approximate the costs of medical tests, procedures, or services in a health economic analysis (16). If a Medicare reimbursement is not available for a particular aspect of medical costs, charges may be used to calculate costs using a cost-charge ratio. Cost-charge ratios allow a calculation of the proportion of hospital charges that represent cost to the hospital. Cost-charge ratios are specific to individual hospital departments and may be available from CMS (http://www.cms.gov).
Surgical costs Health economic analyses in gynecologic oncology may include an estimate of the costs of surgical procedures. CMS reimbursements may be used to approximate these costs from a societal perspective. Direct surgical costs include professional fees (surgeon, anesthesiologist, and pathologist), the cost of hospital recovery, and the costs of any tests or procedures performed in the postoperative period. Postoperative outpatient care is usually part of a global fee that includes the first 90 days of postoperative care, and is therefore not included separately. Likewise, the reimbursement for recovery in the hospital or ambulatory surgery center is usually determined by a CMS code, and this reimbursement covers tests and inpatient care. However, additional procedures performed postoperatively are associated with additional professional fees.
Costs of hospitalization The cost of a hospitalization may be estimated for health economic models using the Diagnosis Related Group (DRG), a CMS code that takes into account the primary diagnosis and the patient’s comorbidities, and is used to determine the reimbursement Medicare provides to the hospital. An alternative method for estimating the cost of an inpatient hospital stay is to use the AHRQ’s Healthcare Cost and Utilization Project (HCUP) Nationwide Inpatient Sample (NIS) (http://www.hcup-us.ahrq.gov/). This large all-payer public database provides inpatient data from a national sample of over 1,000 hospitals in 44 states and is released annually. Mean and median charges and costs of all hospitalizations for a specific primary or secondary diagnosis can be obtained by entering ICD-9 codes. Results can be stratified by demographic information.
Outpatient treatment costs Outpatient treatments in gynecologic oncology often refer to chemotherapy. Cost tabulation should include the CMS reimbursements for the individual chemotherapy drugs and any other medications infused based on the designated J code for each drug. Tests performed routinely over the course of a cycle of treatment should also be included. Finally, the costs of infusion at an outpatient facility should be included using appropriate CPT codes.
Adverse events When 2 or more strategies are compared using a health economic model, it is critical that the adverse events associated with each strategy be accounted for. Specifically, when severe adverse events result in additional medical or nonmedical costs, these costs should be incorporated as well. For example, if one chemotherapy strategy results in a higher rate of febrile neutropenia, the cost of a hospitalization for this diagnosis should be incorporated into the cost of each strategy in proportion to the probability of the event in each treatment group. Adverse events whose frequencies are not significantly different between strategies or that do not generate additional cost (e.g., grade 1 anemia) may reasonably be omitted from a CEA. However, models should adjust for quality of life differences resulting from adverse events.
Cost collection as a component of Phase III trials While many cost-effectiveness studies are performed following completion of the clinical trials from which the data is derived, such analyses are ideally planned and executed in conjunction with prospective Phase III trials. The International Society for Pharmacoeconomics and Outcomes Research (ISPOR) Task Force on Good Research Practices recommends that collection of health economic data should be fully integrated into Phase III studies (16). In a Phase III trial, prospective economic data is usually collected by accounting for differences in health resource utilization between treatment groups. Ideally this might include an accounting of all health-related encounters in each treatment group. However, logistical considerations during trial planning often require prioritization as to which data elements will be collected. Therefore, it is often appropriate to choose to focus on “big ticket” items as well as resources that are expected to differ between treatment arms. Resource utilization collection is accomplished by means of subject diaries in which outpatient and inpatient encounters as well as travel and caregiver time may be recorded. Once resource utilization collection is accomplished, national fee schedules and reimbursements are generally used to assign costs to each element.
Modeling Effectiveness
Effectiveness in CER should be reported in units of relevant clinical outcomes. For example, in oncology studies, effectiveness might be expressed as the number of cases of cancer prevented, the number of unnecessary surgical procedures avoided, or the number of cancer recurrences prevented. However, it is most common in oncology CER to quantify effectiveness using survival. Thus, in cost-effectiveness analyses the comparison of alternative strategies might be described in terms of the cost per additional year of life, or QALY, saved. While overall survival is a standard outcome in both CER and clinical trials, progression-free survival (PFS) may also be reported.
Modeling survival Survival outcomes may be modeled in several ways. One simple method is to assign a survival time (e.g., mean survival in years) to each relevant branch of a simple decision tree. While this method accomplishes the assignment of a survival “value” to each branch of the model, it does not account for additional costs or changes in quality of life that may need to be applied only to subjects who are still alive at a later time. For example, it may be useful to apply the cost of additional cycles of treatment or adverse events to only those individuals remaining alive or progression-free at a specific time point. An alternative, and more common, method is to use a modified Markov state transition model to represent survival (see the section Construction of a Markov natural history model below). When a modified Markov approach is used, costs of events that are applied only if a subject is alive or has relapsed may be applied at each relevant time point. Likewise, changes in quality of life during or after treatment may also be quantified. In the context of comparing effectiveness results of a prospective clinical trial, raw survival data can be used to model Kaplan-Meier survival curves directly (Fig. 18.4).
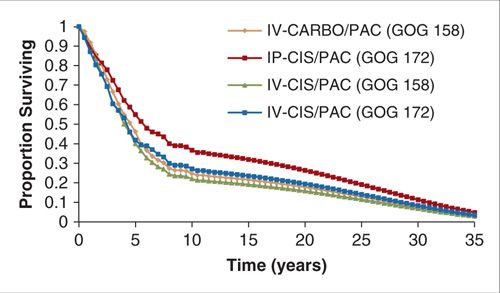
FIGURE 18.4. Survival curve output from a modified Markov state transition model designed to compare the cost-effectiveness of chemotherapy regimens studied in 2 randomized Phase III trials.
Source: Reprinted with permission from Havrilesky LJ, Alvarez-Secord A, Darcy KM, et al. Cost-effectiveness of intraperitoneal compared with intravenous chemotherapy for women with optimally resected stage III ovarian cancer: a Gynecologic Oncology Group study. J Clin Oncol. 2008;26(25):4144–4150. (114)
Modeling Quality of Life
Medical interventions in oncology may improve quality of life without extending life, or may extend life but worsen quality during treatment. Economic analyses that are based only on cost and efficacy do not fully account for the value of many treatments and interventions. CUAs account for the morbidity, physical well-being, and emotional well-being associated with medical treatments. CUAs may be used when the interventions being considered affect both quality of life and survival, or when there is no expected difference in survival but a difference in quality of life is anticipated (4).
In CUAs, quality of life is represented by a utility. A utility is a measure of the desirability or preference that individuals or societies place on a given health outcome (17,18). Utility scores are usually linked to judgments about the value of a particular health state. The anchor health states are 0 for death and 1 for perfect health. Applying utility scores to a cost-effectiveness model allows the outcome of the economic analysis, now the CUA, to be reported in QALYs.
Eliciting preferences for calculation of utility scores Use of utility scores in a cost utility model requires a defined health state for each distinct outcome of the intervention and its alternative (19). For example, health states of interest in ovarian cancer CUA may include: (a) newly diagnosed ovarian cancer starting primary chemotherapy; (b) completed primary therapy, no evidence of disease; (c) progressive disease on treatment; or (d) end-stage ovarian cancer. Descriptions of health states are needed for deriving utilities. The description of each health state includes information about levels of physical health, emotional health, activities of daily living, and overall well-being (20). Because psychological studies report that only a limited number of items can be simultaneously considered by an individual, it is recommended that each health state contain no more than 5 to 9 separate aspects (18,19). A rater provides preferences for each health state and a utility score is created.
Raters are selected according to the perspective of the study. For example, if a societal perspective is taken, then representatives of the population should be used to score the preference (6). The preferences of individuals with conditions of interest (such as patients) or of physicians are important ancillary information that might be incorporated into studies performed from alternative perspectives, but these cannot be substituted for societal preferences when the model’s perspective is societal (11). Several rigorous formal approaches to the direct measurement of preferences and calculation of utility scores for health states have been developed, of which the most commonly used are the standard gamble (SG) and the time-trade off (TTO) methods.
The TTO method presents the rater with a choice between 2 health states, both of which have a certain outcome (21). Raters choose between a set number of years of life in a certain health state (i.e., with disease) and a shorter number of years of life in perfect health. The shortest period of time in perfect health that a rater would accept in exchange for a lifetime in the diseased state determines the utility score. For example, if the rater would accept living the next 20 years (but no less) in perfect health instead of living the next 30 years in the diseased health state, the utility score for the health state would be 20/30 or 0.67. The TTO method is relatively easy for raters to comprehend.
In the SG, raters are asked to choose between two alternatives: one with a guaranteed outcome, and an alternative containing uncertainty or a “gamble.” The guaranteed outcome is the less-than-perfect health state that is being rated. The alternative consists of a treatment that has 2 possible results: Perfect health, with a probability of p, or a worst state (such as death) with a probability 1-p. The value of p is then varied until the rater is indifferent between the choices of the alternative outcome (Fig. 18.5). Visual aids are often used to help the rater understand this exercise, but even with visual aids, some raters have difficulty thinking in terms of probability (19). While there is some debate concerning consistency of results between the SG and TTO, they are both considered standard methods to elicit utilities (18,19,22).
A simple visual-analog scale (VAS) is sometimes used to determine preferences for health states. A rater is shown a line with the anchor states (death, perfect health) at either end. The rater places a mark on this line to demonstrate a preference for the health condition being described. The utility is calculated as the position of the mark on the line divided by the length of the line. Although easy for raters to understand, this method is not “preference-based” due to the lack of the notion of sacrifice that is inherent in the SG and TTO methods (23). The validity of the visual analog method has therefore not been established, and these scales are only moderately correlated with the results from the SG and TTO methods (11).
Use of quality of life instruments and health status classification systems to derive utilities for comparative effectiveness research Measuring preferences for health outcomes using the direct SG and TTO methods is not a simple exercise and is beyond the scope of most clinical trials for which a CUA might be desirable. There exist a number of prescored health status classification systems to allow indirect assignment of utilities based on questionnaires, and calibrated using prior studies of societal preferences. Several of these indirect methods for eliciting utilities are described below.
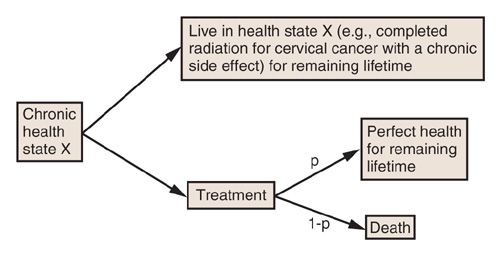
FIGURE 18.5. Schematic describing the standard gamble method to elicit preferences for health states for incorporation into health economic models. “p” is the probability that the proposed treatment will result in restitution of perfect health that will last for the remainder of the subject’s lifetime.
Health utilities index (HUI) is a family of generic health profiles and preference-based systems that measure health status, report health-related quality of life, and produce utility scores. In the commonly used HUI mark 3 classification systems, attributes for which ratings are provided are vision, hearing, speech, ambulation, dexterity, emotion, cognition, and pain. In the multi-attribute approach used for HUI, a respondent completes a questionnaire providing information about her health status that is then scored using a multi-attribute scoring function derived from community preference measures for health states (24). While the HUI is considered a highly valid approach for deriving utilities, it has seldom been used in gynecologic cancer clinical trials.
EuroQoL-5D (EQ-5D) is a simple questionnaire in which raters report no problem, some problem, or a major problem in 5 dimensions: mobility, self-care, usual activities, pain/discomfort, and anxiety and depression (25,26). The ratings are scores from 0 (dead) to 1 (perfect health) and have been measured against the TTO technique on a random sample of 3,000 members of the adult population in the UK (27). The score obtained from the EQ-5D may be directly applied to health economic models and is the method preferred by the UK NICE.
Short form-6D (SF-6D) is a utility instrument based on responses to the longer and widely used SF-36 and SF-12 quality of life questionnaires (28,29). The classification system is based on physical functioning, role limitations, social functioning, pain, mental health, and vitality. The scoring model used for the SF-6D was developed based on the standard gamble utility measurements using a random sample of the UK general population. A scoring table is used to compute utilities from questionnaire responses (4).
Functional assessment of cancer therapy (FACT) is a 33-item scale developed to measure quality of life in patients undergoing cancer treatment (30). It is commonly used in RCTs conducted by the Gynecologic Oncology Group (GOG). The FACT consists of a core instrument (FACT-G) that can be supplemented by various subscales based on the malignancy of interest. While conversion of FACT scores to utilities has been studied (31,32), these methods have not been fully validated. Recent data from the GOG has further evaluated the ability to convert FACT scores to utilities in patients with ovarian cancer, arguing for a prospective trial attempting to address this issue [Hess LM, Brady WE, Havrilesky LJ, Cohn DE, Monk BJ, Wenzel L, Cella D. Comparison of methods to estimate health state utilities for ovarian cancer using quality of life data: A Gynecologic Oncology Group study. Gynecol Oncol. 2012 Oct 30. pii: S0090-8258(12)00851-7. doi: 10.1016/j.ygyno.2012.10.024. [Epub ahead of print]]
To date, the TTO and SG methods are the most accepted methods to develop utility scores. While the use of quality of life instruments eases the labor-intensiveness of collecting preferences using the TTO and SG methods, many question the validity of the use of indirect methods such as quality of life instruments to construct CUAs. At present, there is no clearly superior method for determining utility scores either directly or indirectly. Moreover, some believe that utilities should best be derived from patients as they best know their disease condition (33). Others feel that the preferences of the general public are most relevant because society as a whole must delegate distribution of its health care resources (34). As economic analyses evolve, the limitations of preference ratings should be examined and a consistent method of developing utility scores should be determined to allow for better comparisons to be made across cost-utility studies.
COMPARATIVE EFFECTIVENESS OF SCREENING FOR GYNECOLOGIC CANCERS
In the following section, methods for development of cancer natural history models and their use in screening decision analyses will be described. The current state of evidence for cervical and ovarian cancer screening as informed by comparative effectiveness research will then be reviewed.
Modeling the Natural History of Cancer
To evaluate the comparative effectiveness of a proposed cancer screening test for which no Phase III clinical trials have been completed, a model must be created that simulates the natural history of the disease with and without screening. The simplest model is a decision tree. Although decision trees are useful for modeling outcomes that occur over a short period of time, they can become unwieldy when trying to model a disease that occurs over a longer period or that involves recurrent events such as multiple episodes of screening or multiple cycles of treatment. Consider the decision to perform cancer screening on a woman with a family history of BRCA1/2 mutation. A decision tree could be used to model her likelihood of developing breast or ovarian cancer by 15 years or of dying from another cause over that same time period, but this will not tell us when the woman developed cancer during the given time period, information that may impact the total cost of her care. Another type of model is usually needed to address issues of time dependency when modeling cancer. Markov models are used for events that recur or occur in a predictable manner over time (35). They are particularly well suited to depicting the events associated with cancer, especially cancers that have a screening component.
Construction of a Markov natural history model For creating a Markov model, the natural history of a cancer is broken up into a defined, mutually exclusive, and exhaustive set of states. For cervical cancer, these states would include: well, human papillomavirus (HPV) infection, preinvasive disease, undetected invasive cancer (Stages I though IV), detected invasive cancer (Stages I though IV), cancer death, and death from other causes. For epithelial ovarian cancer, which does not have a universal preinvasive state, natural history states might include: well, undetected and detected invasive cancer (Stages I through IV), cancer death, and death from other causes (Fig. 18.6). Once the states have been defined, movement (usually referred to as “transition”) between the states is defined based on knowledge of the cancer’s natural history. For example, a woman cannot enter Stage II cervical cancer without first having been in Stage I. The arrows in Figure 18.6 depict allowed transitions between states that have been defined for an ovarian cancer natural history model (36). Once the states and allowed transitions have been identified, probabilities of moving from one state to another over a fixed period of time are needed to populate the model. During each “cycle” of the model, allowed transitions between states occur. The cycle length of the model is a time period chosen to correspond to a period that takes into account the natural history of the disease as well as the timing of screening, diagnosis, and treatment recommendations. For most cancers a year is sufficient, although shorter or longer time periods can be used. The probabilities corresponding to the chosen time period for the model (referred to as a Markov cycle) are usually obtained from the epidemiologic literature, an analysis of an epidemiologic study, or expert opinion. Together, the states, allowed transitions, and probabilities constitute the model. Once programmed, the model can be used to calculate different outcomes. Usually, the outcomes are calculated for a cohort (or cohorts) of women who are assumed to enter the model at a given age and then followed until death or a later age (i.e., 100 years).
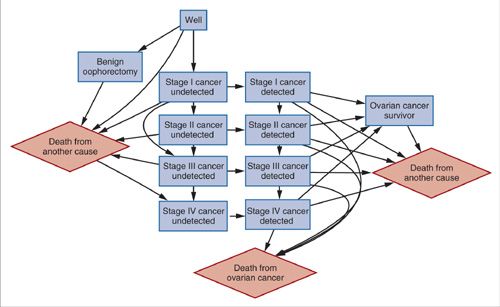
FIGURE 18.6. Influence diagram for models of the natural history of ovarian cancer. Arrows represent allowed transitions between health states. Diamonds represent terminal states.
Source: Reprinted with permission from Havrilesky LJ, Sanders GD, Kulasingam S, et al. Development of an ovarian cancer screening decision model that incorporates disease heterogeneity: implications for potential mortality reduction. Cancer. 2011;117(3):545–553. (36)
Calibration An important step in developing a model is obtaining probabilities or estimates for key variables (referred to as parameters) from the literature. However, often there are few available estimates, estimates of varying degrees of quality, or even no existing estimates for a given model parameter. The selection of a given clinical estimate is important since this affects the credibility of the model’s aggregate result. Calibration is a process that involves comparing the model-predicted results to observed data to ensure a reasonably good fit of one to the other. Model calibration involves several steps: (a) identification of calibration endpoints (for cancer this usually means age-specific cancer incidence, but can also include stage distribution and age-specific mortality curve); (b) establishment of criteria for determining how well the model-predicted data fit the observed data. This may be visual inspection or use of a statistical goodness of fit test; (c) adjustment of the set of model input parameters (i.e., probabilities); and (d) comparison of model-predicted outcomes to observed outcomes using the prespecified criteria and repeating steps 3 and 4 until a satisfactory calibration is achieved (37).
Figures 18.7 and 18.8 show the calibration results for 2 models (ovarian and cervical) that used visual inspection to achieve calibration (36,38). Another calibration method uses goodness of fit statistics and then selects parameter sets that best fit the observed cancer incidence curve. This latter method improves upon visual inspection in a few ways: (a) the calibration goal is formally stated, which can aide with reproducibility and (b) instead of one good fitting set, multiple sets are used, which can account for parameter uncertainty (39).
Validation Model validation (confirming that a calibrated model predicts results that are consistent with observed results from screening trials) can be achieved in a number of ways. The most robust method is to compare model-predicted outcomes with actual outcomes. For example, Havrilesky et al. constructed a natural history model accounting for the observed heterogeneity of epithelial ovarian cancers. Validation was performed by simulating the published prevalence phase of the UK Collaborative Trial of Ovarian Cancer Screening (UKCTOCS) by entering the age and prevalence of disease from the trial population as well as the reported sensitivity and specificity of the trial’s multimodality screening algorithm. The model predicted the stage distribution of cancers detected by screening and the positive predictive value of the multimodality prevalence screen within their reported 95% confidence intervals (36). To the degree that simulated results do not reproduce those observed in a clinical trial, the question arises whether there are key input parameters or model structural differences that affect the conclusions. A model can then be revised to determine whether the prediction is improved in an iterative process. Usually, the initial decision to conduct a modeling study is based on the fact that there are no observed data that exist to answer a given question. In this case, model validation is achieved by comparing the results from models built by different, independent groups, to evaluate for similarity. This approach has been adopted by Cancer Intervention and Surveillance Modeling Network (CISNET). CISNET is a consortium of National Cancer Institute (NCI)-sponsored investigators that uses statistical modeling to study cancer control interventions in prevention, screening, and treatment and their effects on population trends in incidence and mortality. The models in this consortium were independently developed and have been calibrated to US data. The U.S. Preventive Services Task Force has used the results from modeling studies conducted by this group to inform their recommendations for colorectal and breast cancer (40,41).
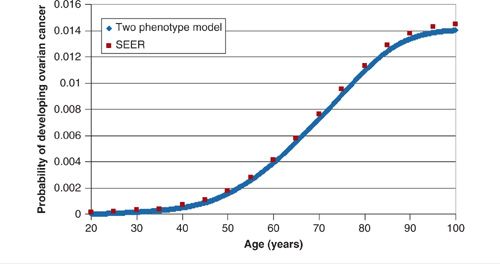
FIGURE 18.7. Calibration of ovarian cancer natural history model on the age-related incidence of ovarian cancer in the US. Blue line represents model output; red dots represent SEER data.
Source: Reprinted with permission from Havrilesky LJ, Sanders GD, Kulasingam S, et al. Development of an ovarian cancer screening decision model that incorporates disease heterogeneity: implications for potential mortality reduction. Cancer. 2011;117(3):545–553. (36)
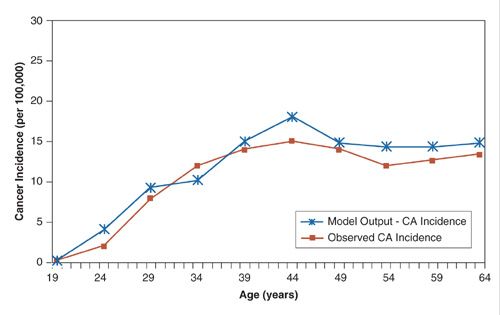
FIGURE 18.8. Calibration of a model of the natural history of cervical cancer on the age-related incidence of cervical cancer in Canada.
Source: Reprinted with permission from Kulasingam SL, Rajan R, St Pierre Y, et al. Human papillomavirus testing with Pap triage for cervical cancer prevention in Canada: a cost-effectiveness analysis. BMC Med. 2009;7:69. (38)
Simulation of Screening
The impact of screening, diagnosis, and treatment can be tracked using a Markov model. Markov models can be programmed to keep count of the outcomes associated with diagnosis, treatment, and screening. Examples include the average number of false-positive or false-negative screening test results, the number of diagnostic procedures such as colposcopy or laparoscopy performed, number of preinvasive lesions detected, and treatments. Other important outcomes include cancer incidence, stage distribution, and mortality. If the cohort of women is modeled over a sufficiently long period of time, the model can be used to calculate life expectancy, lifetime costs, and quality-adjusted life expectancy.
Cervical Cancer
For cervical cancer, modeling has played a particularly prominent role in informing decisions regarding which screening and triage tests to adopt, how frequently women should be screened, and whether the addition of vaccination to screening is cost-effective. This prominent role is due to the fact that trials of new screening tests include follow-up and treatment that often differ from clinical practice, or are conducted in non-US populations with different screening histories. Modeling studies can also be used to project both short- and long-term results from trials. For example, trials for the HPV vaccines used cervical intraepithelial neoplasia (CIN) grade 2 or higher as primary outcomes. However, cancer incidence and death are more important outcomes for policy makers. Modeling has been used to estimate the potential cost-effectiveness of adding vaccination to screening. More recently, modeling has been used to justify the expanded coverage of HPV vaccines to include boys. The following sections describe how natural history models of HPV and cervical cancer are constructed, and how such models have been used to inform policies regarding screening and vaccination for cervical cancer prevention.
Natural history of cervical cancer Natural history models have primarily used the CIN nomenclature to characterize progression from HPV infection through preinvasive disease to invasive cancer. CIN 1 is usually modeled as a separate category from CIN 2 or 3, to reflect the general consensus that this lesion represents a self-limited infection that has a high likelihood of spontaneously regressing. However, while some have combined CIN 2 and 3 into a single category (42–47), others have separated these 2 categories (48–50). Separating CIN 2 and 3 in modeling is based on the findings of a large trial that suggested that CIN 2 may be a self-limited lesion, especially in young women (51). Moreover, ongoing and recently completed trials examining the potential role of HPV DNA testing in screening have chosen CIN 3 as the surrogate endpoint for cancer (52). By separating CIN 2 and 3, these models are able to predict the extent to which the detection and treatment of CIN 3 will lead to reductions in cancer incidence and mortality.
Until recently, models have based progression and regression rates between the different states on estimates that were averaged across different HPV types (53). However, models that can quantify the impact of type-specific infection have now been developed, prompted by several factors: (a) the availability of HPV vaccines that are targeted at a few HPV types; (b) the U.S. Food and Drug Administration approval of type-specific HPV tests; and (c) guidelines that allow for triage to immediate treatment based on type-specific HPV infection. These more recent models have stratified progression and regression between different CIN states by HPV type. For example, Sanders and Taira grouped HPV into low- and high-risk types (54), Goldie et al. grouped HPV into low-risk, high-risk, and HPV 16 and 18 (55), and Elbasha et al. modeled 4 HPV types only: HPV 6, 11, 16, and 18 (50). A more recent model by Kim and Goldie (2008), designed to assess vaccine strategies in the US, stratified HPV infection by HPV 16, HPV 18, and other high-risk and low-risk types (56,57). Of note, to assess the potential impact of vaccines with more HPV types than those currently available, Brisson et al. have further stratified an HPV model using 18 HPV types. As our understanding of the natural history of each type grows, HPV type-specific testing is becoming more common and vaccines are being expanded to include additional HPV types. In this changing environment, models will need to further stratify by HPV type to better predict the expected benefits and harms of type-specific testing and vaccination.
Questions Addressed by Cervical Cancer Models
Appropriate age to begin/end and screening interval with cytology A mathematical model of cervical cancer, developed in the 1980s by David Eddy, was used to examine the relationship between screening interval using Pap smears and cancer incidence (58). This modeling study showed that screening every 2 or 3 years would result in 95% to 99% of the cancer reduction benefit of screening every year, but with lower costs and fewer procedures. In terms of the age to begin and end screening, these have for the most part been based on epidemiologic data showing that cancer incidence peaks in the late 30s to mid-40s, but that the incidence of CIN peaks in the 20s. Given this, guidelines have usually called for screening in the late teens and early 20s, although there has been a shift toward a recommendation to begin screening in the 20s in more recent years (59,60). Canfell et al. modeled the impact of changing the UK screening guidelines to begin at 25 years of age, instead of 21 years (61). They found that if the age to start screening was delayed until 25, the lifetime risk of cancer would be minimally affected (cumulative lifetime incidence decreasing from 0.63% to 0.61%) due to the low incidence of cancer in young women (61). More recently, Kulasingam et al. modeled the impact of varying the age to begin screening in 1-year increments from age 15 years to age 25 years on cancer incidence and mortality (62). They showed that screening in the teens was associated with a high number of additional diagnostic procedures and small reductions in lifetime risk of cancer compared to delaying screening until the 20s. In terms of the age to end screening, Canfell et al. showed that further reductions in lifetime incidence of cancer (from 0.63% to 0.56%) could be achieved if screening were extended from age 64 to 79 and conducted at 5-year intervals (61). Kulasingam et al. estimated the impact of continuing to screen women who had been screened every 3 years since age 21 beyond age 65 years, and showed small incremental reductions in cancer but large increases in additional procedures (62). Although the differences in conclusions between the 2 modeling studies are presumably due to differences in screening intervals modeled, other differences that may play a role include benign hysterectomy rates, deaths from other causes, or cohort effects in screening. Importantly, these studies illustrate how modeling can be used to examine issues related to age that epidemiologic studies may not be able to answer.
Liquid-based cytology versus conventional cytology Models are particularly useful for predicting the impact of the adoption of new screening tests or treatments on cancer incidence and mortality. However, model conclusions are heavily dependent on the quality of the data used to inform key parameters such as test sensitivity and specificity. An example is the modeling that compared the cost-effectiveness implications of conventional cytology smears to liquid-based cytology smears (63,64). These early studies used estimates of test accuracy from nonrandomized studies. These studies suggested that liquid-based cytology had a higher sensitivity and comparable specificity to conventional cytology. As a result, adoption of liquid-based cytology for cervical cancer screening in the U.S. was predicted to be cost-effective compared to screening with conventional cytology. More recently, however, RCTs and meta-analyses have concluded that there is no significant difference in test performance between liquid cytology and conventional cytology (52).
Use of HPV testing in screening A number of randomized trials (both ongoing and recently completed) have shown that HPV DNA testing is more sensitive but less specific than cytology for detection of CIN 3+ (52). A number of studies have examined the cost-effectiveness of adding HPV DNA testing (with either PCR-based tests or hybrid capture 2) to screening programs (65). Strategies examined include co-testing (simultaneous testing with both cytology and HPV DNA, with referral for treatment if either is abnormal), primary testing with HPV followed by triage using cytology if the HPV DNA test is abnormal, primary testing with HPV only, and primary testing with cytology followed by triage using HPV DNA for those with abnormal cytology results. Across a range of settings, these studies suggest that the cost-effectiveness of adding HPV DNA to cytology-based screening depends on whether the interval between screening tests can be increased as well as the follow-up for women with discordant test results.
Of the different HPV and cytology strategies that have been compared for cost-effectiveness, one strategy in particular shows promise across a range of analyses and settings. HPV DNA testing followed by triage based on cytology for women with positive HPV results has been identified as a potentially cost-effective strategy compared to both cytology alone and the co-testing strategies (66,67). This strategy, which uses a sensitive test first (HPV), followed by a specific test (cytology), allows one to maximize detection of high-grade disease, while potentially minimizing false-positives, thereby reducing the costs of screening. Results from ongoing trials, such as the HPV-FOCAL trial in Canada, which has recently reported preliminary validation of this strategy, will be needed to confirm whether the modeling predictions are correct (68).
Quantifying the impact of HPV vaccination Two types of models have been used to explore HPV vaccine effectiveness: Markov state transition cohort models (described above) and dynamic transmission models, with a third category – hybrid models – that use a combination of the two (69). Dynamic models track population changes over time by taking into account births as well as deaths. Importantly, dynamic transmission models also explain how infection with HPV depends on patterns of sexual behavior and the distribution of infection in the population (70). As such, a strength of dynamic models is that they can be used to determine herd immunity, explore the relative value of vaccinating boys in addition to girls, and explore how sexual mixing patterns (how men and women form partnerships and how these affect transmission) affect the age at which vaccination should begin and age(s) for catch-up programs (i.e., vaccination offered to girls and/or women who are not part of the optimal age group but who may still derive a benefit). These indirect effects are not captured by Markov models; as a result, Markov models may underestimate the effect of vaccination. Hybrid models use both approaches – generating HPV incidence under different vaccination scenarios from a dynamic model, which is then used as an input to the Markov model. A recent modeling study conducted using multiple, independently developed HPV and cervical cancer models concluded that vaccination of girls prior to the age of sexual debut has the potential to considerably reduce the burden of CIN and cervical cancer (71). This is especially true if a long duration of vaccine efficacy and high vaccine coverage are modeled. Vaccine price has also consistently been shown to impact the cost-effectiveness of adding vaccination to screening or adding HPV vaccines to existing vaccine programs. Indeed, if HPV vaccines are priced below certain thresholds for different countries, HPV vaccination could potentially be cost-saving compared to not screening (72). Of note, across a range of analyses, vaccination of girls only prior to onset of sexual activity, as opposed to vaccination of boys and girls plus catch-up vaccination, has been shown to have the most attractive cost-effectiveness profile. However, under conditions of low coverage, as has occurred in the US, extending vaccination to boys is potentially cost-effective (73). On the basis of these results, and survey data showing low uptake of the HPV vaccines in the U.S., the Centers for Disease Control and Prevention Advisory Committee on Immunization Practices decided to extend HPV vaccine recommendations to include boys in addition to girls (http://www.immunize.org/acip/acipvax_hpv.asp). In terms of which vaccine to use (bivalent or quadrivalent), modeling from the UK suggests that the bivalent vaccine (which is targeted at 2 carcinogenic HPV types, 16 and 18) would need to be less costly than the quadrivalent vaccine (which protects against the same HPV types, 16 and 18, as well as 2 types associated with >90% of genital warts) to be equally cost-effective (66,74).
Screening in the era of HPV vaccines The issue of whether and how screening should change in the era of HPV vaccines is complex and will depend on a number of factors that are still unknown. These include, but are not limited to, the performance of cytology and HPV tests such as hybrid capture 2 that are not type-specific, whether predicted reductions in CIN and cancer are achieved, and whether vaccination will affect screening behavior, in particular, screening participation. Under the assumption that vaccines will markedly reduce cancer incidence and mortality, potentially cost-effective approaches to screening vaccinated cohorts of women include strategies that use a less frequent screening interval, delayed age of first screening, and/or use of a strategy based on HPV DNA testing followed by cytology (66,75). Preliminary modeling to examine the impact of cross-protection and broad spectrum vaccines (such as the Merck octavalent vaccine that is currently in early trials) suggests that far fewer screens than are currently recommended will be needed to achieve significant reductions in cervical cancer (76).
Modeling has been used extensively in cervical cancer to inform how we should approach screening and add HPV vaccination programs to screening programs. Given the development of new tests for cervical cancer and new vaccines that cover more HPV types than the first generation of HPV vaccines, modeling will continue to play a key role in determining the most effective and cost-effective strategies for prevention of cervical cancer.
Ovarian Cancer
Because the majority of ovarian cancers are diagnosed at an advanced stage, there has been considerable interest in designing screening strategies to diagnose and treat women earlier, in the hopes of improving survival outcomes. While screening for breast and colon cancer has been proven to reduce mortality, no screening test for ovarian cancer has yet been proven effective. Several key parameters may impact the success of any cancer screening program: (a) availability of effective treatment for screen positive individuals; (b) sufficiently high disease prevalence; (c) existence of an effective screening test; and (d) acceptable cost or cost-effectiveness of the screening program. Each of these parameters is addressed below in the context of development of a screening test for epithelial ovarian cancer.
Effectiveness of treatment Pathologic and genetic data now suggest that epithelial ovarian cancer is a heterogeneous disease, with a number of different precursor lesions. Many high-grade serous ovarian cancers likely originate in the fallopian tubes, while some clear cell and endometrioid lesions may originate in endometriosis. Because there is no universal, clearly defined precursor lesion for all epithelial ovarian cancer, the target lesion for the screening tests that are currently in Phase III trials is stage I disease. Targeting early-stage disease is appropriate because survival from epithelial ovarian cancer diagnosed at stage I is encouraging. Women with stage I disease with low-risk features may be cured without the need for adjuvant treatment, while those with higher risk stage I disease may still achieve excellent outcomes following 3 to 6 cycles of platinum-and taxane-based chemotherapy (77).
Disease prevalence Perhaps the biggest challenge to the development of a successful ovarian cancer screening program is the low prevalence of this disease. The lifetime incidence of ovarian cancer in the U.S. is approximately 1.4%. In postmenopausal women, the most likely target population for a screening program, its prevalence is approximately 40 per 100,000 women. Disease prevalence has a direct impact on the achievable positive predictive value of a screening test, which defines the number of diagnostic procedures or surgeries that would be required to diagnose one case of ovarian cancer. Expert opinion suggests that the minimal acceptable positive predictive value for an ovarian cancer screening test should be 10%. To achieve this value in the postmenopausal population, a screening test needs to have a specificity exceeding 99.6%.
Effectiveness of screening test To date, no screening test for ovarian cancer has been proven effective in reducing mortality from this disease. Two large randomized trials have recently been performed to evaluate screening strategies utilizing the CA-125 serum test and transvaginal ultrasound. The Prostate, Lung, Colorectal, and Ovarian (PLCO) screening trial randomized 78,216 women to either usual care or a combination of annual CA-125 for 6 consecutive years and annual transvaginal ultrasound for 4 consecutive years (78). Follow-up of test results was determined by each subject’s primary physician. After a median follow-up of 12.4 years, there was no difference in stage distribution at diagnosis of ovarian cancer (77%–78% stage III–IV) and no difference in ovarian cancer mortality between the screened and unscreened groups. However, there was evidence of possible harm due to the screening intervention, in the form of a 15% rate of serious adverse events among women with false-positive screening tests who underwent surgical procedures. The authors concluded that simultaneous screening with CA-125 and ultrasound does not reduce ovarian cancer mortality and may introduce harm (79).
A second large screening trial, the UKCTOCS study, randomized 202,638 postmenopausal women to no intervention, annual transvaginal ultrasound, or a multimodality algorithm incorporating annual CA-125 and second-line transvaginal ultrasound. In the prevalence round of screening, the multimodality screening algorithm had a sensitivity of 89.5% and specificity of 99.8% and resulted in a more favorable stage distribution than the no-intervention group, with over 47% of ovarian cancers diagnosed at stage I or II. While mortality results from this trial are pending, the authors concluded that the prevalence screen data were encouraging regarding the feasibility of this screening program (80).
Comparative effectiveness of screening Several groups have used mathematical modeling to determine the likely success and cost-effectiveness of screening strategies. Skates and Singer designed the first reported stochastic simulation model of the natural history of ovarian cancer. This model, which assumed orderly progression from stage I to stage IV and estimated the mean time spent in stage I at 9 months based on the expert opinion of gynecologic oncologists, suggested that screening using CA-125 could potentially save 3.4 years of life per case of cancer detected (81). Urban et al. subsequently modified the Skates and Singer model and performed a cost-effectiveness assessment of several screening strategies. The authors reported that multimodality screening with CA-125 followed by transvaginal ultrasound only if CA-125 was positive or doubling was potentially cost-effective compared to single test strategies and no screening (82).
More recent screening models have incorporated new data about the pathophysiology and progression of ovarian cancer. Havrilesky et al. constructed a natural history model that, based on the physical proximity of the ovaries to upper abdominal organs such as small bowel and omentum, allowed progression of stage I cancers either to stage II or directly to stage III (83). Disease incidence, mortality, and stage distribution were calibrated to reflect Surveillance Epidemiology and End Results (SEER) data. A modified version of this model was designed to account for the heterogeneity of ovarian cancer by modeling aggressive and indolent phenotypes with different rates of progression (36). These models highlighted factors that are important to the success of a screening program. For example, increasing the frequency of screening had a more favorable impact on reducing cancer mortality than increasing the sensitivity of the individual screening test. However, due to the increased cost of screening more frequently, increasing the frequency actually reduced cost-effectiveness. Both models reinforced the important link between specificity and positive predictive value. An annual screening test with a sensitivity of 85% and specificity of less than 99% would have a positive predictive value not exceeding 4%. However, at a specificity of 99.9%, the positive predictive value for annual screening was excellent at 22%. Annual screening of a population of women aged 50 to 85 years at average risk of ovarian cancer with a test at 85% sensitivity and 95% specificity was predicted to improve life expectancy 2.92 days on average, with an ICER of $73,469/YLS compared to no screening. However, simulated screening of a “high-risk” population of women aged 50 to 85 years with a relative risk of developing ovarian cancer of 2 resulted in an improvement in the ICER to $36,025/YLS when compared to no screening. In sensitivity analysis, key factors in achieving a cost-effective screening test (defined as an ICER of less than $50,000/YLS) were an inexpensive test, a very high test specificity, and infrequent (annual or less) testing. Screening appeared to be potentially most cost-effective when the test specificity was well above 99% and the testing interval was annual or less frequently (83).
These prior models confirm that very high test specificity is required to achieve acceptable positive predictive values and that population-based screening may not be cost-effective in the form currently being evaluated in clinical trials. However, annual screening for ovarian cancer appears to be potentially cost-effective in high-risk populations and at very high screening test specificities. Both mortality data and final analysis of the costs of the multimodality screening algorithm in the UKCTOCS trial are critical to any assessment of the costs, benefits, and potential cost-effectiveness of currently available screening strategies. Moreover, because none of the health economic models of screening performed to date have taken quality of life into account, any health economic assessments of ovarian cancer screening would be premature.
Primary prevention in high-risk women Women who are carriers of genetic mutations in BRCA1 or BRCA2 are at markedly increased risk for ovarian cancer; the average risk of developing ovarian cancer by age 70 is 39% (95% confidence interval [CI], 18%–54%) for BRCA1 mutation carriers and 11% (CI, 2.4%–19%) for BRCA2 mutation carriers (84). Likewise, women with Lynch syndrome-associated MLH1 and MSH2 mutations have up to 20% (CI, 1%–65%) and 24% (CI, 3%–52%) risk, respectively, of developing ovarian cancer by the same age (85). Although the prevalence of genetic mutations predisposing women to ovarian cancer in the general population is low, the high risk of cancer among women who are mutation carriers underscores the importance of modifying their likelihood of developing cancer.
The choice of a risk-reduction strategy for women at elevated risk is an individual one and commonly includes screening strategies and prophylactic surgery. Unfortunately, screening high-risk women with available modalities has not yet proven successful (86–88). In a BRCA1/2 mutation–carrying population, bilateral salpingo-oophorectomy (BSO) has been demonstrated to reduce the risk of ovarian, tubal, or peritoneal cancers by 80% and the risk of breast cancer by 50% (89). In addition, several groups have designed health-economic decision models demonstrating that prophylactic surgery is both effective and cost-effective in women at high genetic risk for ovarian cancer (90–93). However, surgical prophylaxis performed prior to menopause is accompanied both by potential harm and the certain premature loss of ovarian function and is not generally recommended in the general population (94,95). Despite the effectiveness of prophylactic BSO, some women at high risk prefer alternatives that are less invasive, do not result in early menopause, and preserve fertility. The GOG is currently completing a nonrandomized prospective trial comparing longitudinal screening with CA-125 and ultrasound to risk-reducing BSO in a high genetic risk population (96). This trial includes both subsequent cancer diagnoses and quality-of-life assessments, and may be informative from a comparative effectiveness standpoint.
COMPARATIVE EFFECTIVENESS OF THERAPEUTICS IN GYNECOLOGIC CANCERS
The comparative effectiveness literature regarding therapeutic interventions for gynecologic malignancies is reviewed in the next section.
Ovarian Cancer
Chemotherapy for newly diagnosed ovarian cancer The standard treatment for ovarian cancer is primary surgical staging with maximum possible cytoreduction followed by chemotherapy. Intravenous chemotherapy usually consists of a taxane and a platinum agent for 3 to 6 cycles; patients with advanced intraperitoneal disease are often candidates for intraperitoneal chemotherapy (97). The addition of bevacizumab to primary chemotherapy followed by consolidation bevacizumab has been found to provide a short-term additional benefit in Phase III trials (98,99). Likewise, dose-dense paclitaxel was associated with clinical benefit in one Phase III trial and is now under investigation by the GOG (100). As novel chemotherapy regimens for primary treatment emerge, some consideration should be given not only to the number of months of survival benefit, but to the costs and effects on quality of life of each.
Introduction of taxanes The first cost-effectiveness studies in ovarian cancer chemotherapy were performed in response to the introduction of taxanes into the frontline chemotherapy regimen for this disease. Two independent RCTs, conducted by the GOG 111 and a European-Canadian Intergroup (OV-10), demonstrated that cisplatin plus paclitaxel as primary chemotherapy is superior to previous therapy of cisplatin plus cyclophosphamide in clinical response rate, progression-free survival, and overall survival (101–103). Three Phase III RCTs subsequently proved similar efficacy of paclitaxel in combination with either carboplatin or cisplatin for the adjuvant treatment of ovarian cancer (104–106). The carboplatin combination was better tolerated and has subsequently become a standard first-line treatment (107).
When first introduced, paclitaxel-cisplatin was a more expensive therapy than the old standard of cyclophosphamide-cisplatin. A number of cost-effectiveness investigations were performed using data from GOG 111, which compared cisplatin plus paclitaxel to cisplatin plus cyclophosphamide. From the perspective of a US oncology practice, the total drug costs for cisplatin plus paclitaxel were 4 times higher than those for cisplatin plus cyclophosphamide (US $9,918 vs. US $2,527; year of costing not specified) (108). Compared with cisplatin plus cyclophosphamide, the incremental costs per year of life gained for cisplatin plus paclitaxel therapy were US $19,820 for inpatient treatment and US $21,222 for outpatient treatment. These incremental costs fall well within the generally accepted cost-effective range for new therapies.
Several cost-effectiveness analyses examined the addition of paclitaxel to first-line therapy from the perspective of health systems outside the US. From a Canadian health system perspective, cisplatin plus paclitaxel had an ICER of CaD $32,213 (1993 costs for drug and hospital costs) per life-year gained compared to cyclophosphamide-cisplatin (109). The investigators originally concluded that it may not be possible to adopt this therapy as first-line for all advanced-stage ovarian cancer patients because it would cost the province of Ontario an additional CaD $9 million a year. Berger et al. investigated the cost-effectiveness of cisplatin plus paclitaxel from the perspective of various European countries’ national health services. The incremental costs of cisplatin plus paclitaxel per life-year saved were evaluated for Germany (US $9,362), Spain (US $6,395), France (US $6,642), Italy (US $11,420), the Netherlands (US $7,796), and the UK (US $6,403) (110).
Carboplatin and paclitaxel are now both marketed as generics, and therefore these prior studies are less applicable than when originally published. Given the current low cost of paclitaxel, any clinically superior regimen using this drug is also likely to be found cost-effective. Chan et al. have recently performed an economic analysis based on results of a Phase III Japanese GOG trial (100), demonstrating that weekly dose-dense paclitaxel is cost-effective compared to a 3-week regimen in the setting of primary treatment (111).
Intraperitoneal chemotherapy The NCCN Guidelines for ovarian cancer recommend intraperitoneal (IP) chemotherapy as primary/adjuvant therapy for optimally debulked (<1cm) stage II or greater ovarian cancer treatment (112). Three Phase III clinical trials have identified advantages to the use of IP chemotherapy for adjuvant treatment of stage III ovarian cancer (97,113,114). The most recent of these studies demonstrated an overall survival advantage of 16 months in the IP arm at the expense of increased risk of adverse events and a significant reduction in quality of life.
Two analyses have evaluated the cost-effectiveness of IP chemotherapy for the primary treatment of stage III ovarian cancer. When comparing IP to intravenous (IV) chemotherapy, Bristow et al. reported that IP chemotherapy was potentially cost-effective compared to IV, with an ICER of $37,454 per QALY (115). Havrilesky et al. reported an estimate of $180,022 per QALY when using a 7-year time horizon, which was consistent with the current duration of survival results from GOG 172 (116). However, when the time horizon was extended to a lifetime under the assumption that any survival advantage realized with IP chemo would persist over that period, the ICER of IP chemotherapy dropped to $32,053 per QALY. Also of note, under the assumption that IP chemotherapy is equally effective as an outpatient regimen, the ICER of IP compared to IV chemotherapy becomes even more attractive. While both studies informally incorporated quality of life based on the FACT surveys administered to patients enrolled on GOG trials of chemotherapy, neither performed a validated utility assessment. Conclusions that may be drawn from these studies are that IP chemotherapy is potentially cost-effective for women with stage III disease, but that more formal incorporation of quality of life, longer term follow-up of the results of the last Phase III study, and investigation of less costly outpatient IP regimens would strengthen this conclusion (115,116).
Bevacizumab Bevacizumab is an anti-vascular endothelial growth factor (VEGF) inhibitor of angiogenesis and is FDA-approved for treatments of renal cell carcinoma, colorectal cancer, glioblastoma, and non-small cell lung cancer. The ICON7 and GOG 218 Phase III clinical trials of newly diagnosed ovarian cancer independently reported a small 2- to 6-month PFS advantage to the addition of bevacizumab to primary combination carboplatin/paclitaxel, followed by 14 to 22 additional cycles of consolidation bevacizumab in the absence of progression (98,99). Even prior to the initial presentation of this data in ovarian cancer, questions were raised about the cost of universal bevacizumab. Cohn et al. performed a cost-effectiveness analysis examining the likely clinical benefit of bevacizumab and the cost of the drug as well as its associated adverse events. This analysis demonstrated that there was no reasonable scenario under which bevacizumab could be considered cost-effective by existing measures (117).
A subset analysis of the ICON7 data revealed that the main benefit appears to be confined to women with high-risk disease such as those suboptimally cytoreduced and those with stage IV disease (99). While, ideally, treatment of a smaller subset of women with ovarian cancer who are most likely to benefit would make this drug more cost-effective, initial attempts at modeling this scenario did not demonstrate this to be a cost-effective alternative (118).
Consolidation therapy Consolidation regimens that have been studied for ovarian cancer are paclitaxel and bevacizumab; both have proven PFS benefits but neither has demonstrated an overall survival benefit. Lesnock et al. performed a cost-effectiveness analysis of consolidation therapy following carboplatin/paclitaxel, comparing 12 months additional paclitaxel to 17 cycles of additional bevacizumab. Clinical data were derived from the PFS results of GOG 178 and GOG 218. Consolidation therapy with paclitaxel was found to be cost-effective, with an ICER of $13,402 compared to no consolidation therapy. Bevacizumab consolidation was dominated (less effective and more costly) by paclitaxel consolidation. This study was performed prior to mature overall survival results of GOG 218 and the authors noted that a significant overall survival improvement would potentially improve the value of bevacizumab consolidation (119).
Chemotherapy for recurrent ovarian cancer Most women with ovarian cancer will achieve clinical remission following surgery and primary adjuvant chemotherapy. Unfortunately, the majority of patients eventually develop recurrent disease which is rarely curable (120). Patients who experience recurrence more than 6 months after completing a first-line chemotherapy regimen are considered to have “platinum-sensitive” ovarian cancer and have an excellent response rate when re-treated with platinum agents (121,122).
The optimal treatment of recurrent ovarian cancer is subject to ongoing debate and is affected by considerations of survival, toxicity, and quality of life. Patients with platinum-sensitive disease have a good response rate to re-treatment with platinum-based regimens; two large RCTs have compared the use of single-agent therapy with combination regimens for platinum-sensitive ovarian cancer. These studies identified a PFS advantage for the combination regimens of gemcitabine plus carboplatin and paclitaxel plus platinum chemotherapy regimens (as well as an overall survival advantage for paclitaxel plus platinum) compared to platinum alone, and the authors suggested that the combination regimens should be considered standard of care (123,124).
On the basis of these 2 studies, Havrilesky et al. designed a Markov state transition model that evaluated the optimal treatment strategy for patients with recurrent platinum-sensitive ovarian cancer. Paclitaxel plus carboplatin had an ICER of $15,564 per additional progression-free year compared to single-agent carboplatin, while gemcitabine plus carboplatin has a less attractive ICER of $278,388 per additional progression-free year compared to paclitaxel plus carboplatin (125). Given that both carboplatin and paclitaxel are now available as generic drugs in the US, their cost advantage is not surprising. Neurologic and hematologic toxicities of the regimens were incorporated into a sensitivity analysis that varied the severity and costs associated with treatment. Over a reasonable range of utility scores, paclitaxel plus carboplatin was still cost-effective compared to carboplatin alone, and gemcitabine plus carboplatin remained non-cost-effective (125). These results must be interpreted on an individual basis with an individual’s prior adverse event profile in mind; for example, it is unlikely that a patient with severe neurotoxicity due to prior taxane treatment would be re-treated with the same drug.
Recurrent ovarian cancer that occurs within 6 months of completing a first-line chemotherapy regimen has a poor prognosis, with cure being very unlikely. Rocconi et al. performed a cost-effectiveness analysis of treatment options for recurrent platinum-resistant ovarian cancer and concluded that only best supportive care (no chemotherapy) was clearly cost-effective, while second-line monotherapy was possibly marginally cost-effective (ICER $64,104/YLS) as well (126). Even without incorporation of toxicity rates and costs, the authors found that combination chemotherapy regimens were never cost-effective for platinum-resistant disease due to unfavorable ICERs.
Cervical Cancer
Primary treatment The standard treatment of cervical cancer has been established for very early-stage and locally advanced-stage disease. However, there is continued debate over the appropriate treatment of Stage IB2 disease (127). Current options include primary surgery with radical hysterectomy and lymphadenectomy followed by tailored chemoradiation, primary chemoradiation, or neoadjuvant chemotherapy followed by radical hysterectomy and tailored chemoradiation. The choice of therapy depends on many factors including available resources, costs, patient characteristics, and physician preferences.
Two groups have developed health economic models to inform the treatment of stage IB2 cervical cancer. Rocconi et al. developed a decision model with a third-party payer perspective to compare 3 strategies: (a) radical hysterectomy followed by tailored therapy; (b) primary chemoradiation; and (c) neoadjuvant chemotherapy followed by simple hysterectomy. The metric used for comparison was a cost-effectiveness ratio in dollars per patient cured. Cure was defined as survival disease-free at 5 years. An ICER was not reported. Radical hysterectomy was the least costly strategy per survivor at $41,212. Chemoradiation and neoadjuvant chemotherapy was followed by simple hysterectomy cost $43,197 and $72,613 per survivor, respectively (128). The authors concluded that radical hysterectomy is the most cost-effective treatment for stage IB2 cervical cancer.
In a second analysis, Jewell et al. used a modified Markov state transition decision model to compare primary chemoradiation (CR) to primary radical hysterectomy with tailored adjuvant therapy (RH+TA) for the treatment of stage IB2 cervical cancer. A third-party (payer) perspective was assumed. A small percentage of patients in the RH+TA group were assumed to have the radical hysterectomy abandoned due to advanced disease not detected by preoperative positron emission tomography (PET)/computed tomography (CT). Patients undergoing completed radical hysterectomy were divided into 3 risk groups based on surgical pathologic risk features. On the basis of literature review, it was assumed that 5% of patients would have high-risk features on final pathology, 85% would have intermediate-risk features, and 10% low-risk features. Patients with high-risk features were assumed to receive adjuvant chemoradiation (4500 cGy external beam radiotherapy with weekly sensitizing cisplatin followed by vaginal cuff high-dose rate [HDR] brachytherapy). Patients with intermediate-risk features would either receive no adjuvant treatment or external beam radiotherapy plus chemotherapy. Patients at low risk for recurrence would receive no adjuvant treatment. Adverse events included in the model were: anemia, neutropenia, deep vein thrombosis/pulmonary embolism, gastrointestinal fistula, gastrourinary fistula, hydronephrosis, bladder dysfunction, small bowel obstruction, radiation proctitis, cystitis, severe infection, and vaginal dysfunction. The costs for individual primary treatment modalities were obtained using 2007 national Medicare reimbursement and fee schedules (http://www.cms.hhs.gov). The costs associated with treatment of each severe (CTCAE grades 3–5) nonhematologic adverse event were obtained from the national database of the AHRQ’s HCUP (www.hcup.ahrq.gov). The model predicted 5-year overall survival of 79.6% in the RH+TA arm and 78.9% in the CR arm. The mean cost of RH+TA was $27,840 compared to $21,403 for CR. The ICER comparing RH+TA to CR was $63,689 per additional YLS (129).
Although this analysis did not find that radical hysterectomy was cost-saving, sensitivity analysis showed that radical hysterectomy was potentially cost-effective (i.e., the cost per life-year saved was within the range considered acceptable—approximately $50,000–75,000/life-year) (129). While Rocconi et al. found radical hysterectomy with tailored adjuvant therapy to be the least expensive option, Jewell et al. found that RH+TA was the costlier treatment option in the base case. The difference in the outcomes may be related to Jewell’s assumption that a higher proportion of women with stage IB2 cervical cancer who are treated with RH will receive adjuvant radiotherapy (47% vs. 40%), or their lower cost estimates for radiation treatments, possibly due to the use of Medicare reimbursement data to approximate costs and an institutional practice of using LDR, which appears to be less costly than HDR.
The differences in the outcomes in these models demonstrate the difficulty in economic analyses and show how the assumptions, inputs, and design of a model are critical to its results. These models were strictly cost-effectiveness models and neither incorporated quality-of-life measures. Cost-effectiveness models that lack consideration of quality of life may under- or over-estimate the value of a given treatment strategy.
Quality-of-life–related preferences for treatment Jewell et al. elicited preferences for calculation of utility scores from cervical cancer survivors and the general public for the treatment of early-stage cervical cancer. The authors created descriptions of health states that included detailed information about available treatments for early-stage cervical cancer. Surgical scenarios ranged from minimally invasive radical hysterectomy with low-risk pathology requiring no additional treatment to aborted radical hysterectomy due to locally advanced disease followed by primary chemoradiation and brachytherapy. Primary chemoradiation (including teletherapy and brachytherapy) was also evaluated. Physical and emotional aspects of each treatment were outlined and, where appropriate, details about initial postoperative recovery, outpatient whole pelvic radiation, outpatient chemotherapy, and inpatient brachytherapy were described in each health state scenario. Common side effects were incorporated into each description. The TTO method was used. Health states describing chemoradiation were less preferred than health states describing surgery, regardless of whether adjuvant chemoradiation was given (Table 18.2). Even in health scenarios with similar 5-year survival, subjects ranked surgery followed by tailored adjuvant treatment as equivalent or slightly preferred over primary chemoradiation. The subject ranked a minimally invasive approach as most preferred, suggesting that an overnight hospitalization, smaller incision sites, and faster return to activities of daily living are preferred (130).
Use of radiation therapy in cervical cancer Intracavitary radiation treatment is recognized to play a significant and important role in the standard radical radiotherapy treatment of cervical carcinoma. The majority of centers worldwide use either low-dose rate (LDR) or high-dose rate (HDR) methods. Randomized trials have confirmed the apparent equivalence of HDR and LDR in terms of the incidence of adverse effects, tumor control, and survival (131). HDR is becoming more prevalent, possibly based on its outpatient nature, the ability to treat a greater number of patients, the ability to treat tumors at different sites, and the perceived cost savings to the health care system mainly due to the outpatient setting of the treatment. However, HDR treatment costs per insertion are frequently greater than LDR and increasing attention is now being paid to thorough health economic analysis by health care professionals in an attempt to reduce the escalating health care costs.
Utility Scores Elicited from Members of the Public and Cervical Cancer Survivors for Health States Related to the Treatment of Newly Diagnosed Cervical Cancer |
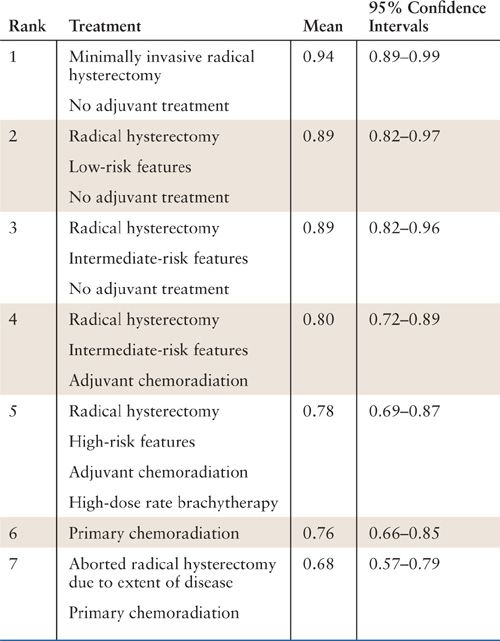
Reprinted from Jewell EL, Smrtka M, Broadwater G, et al. Utility scores and treatment preferences for clinical early-stage cervical cancer. Value Health. 2011;14(4):582–586, with permission. (130)
Jones et al. undertook a formal analysis of LDR versus HDR brachytherapy from a Canadian hospital perspective (132). The cost model incorporated fixed and direct costs arising from equipment purchases, equipment maintenance fees, costs of patient care, and operating costs (staff and operating room costs). The cost to a hospital of an HDR administration unit is greater than the costs of each type of LDR unit. On the basis of this cost difference and the practical limitations on the number of patients who can be accommodated by each machine per year, this study demonstrated that the LDR technique is less expensive when treating up to 80 patients per year. However, the ability to treat a significantly greater number of patients and the potential to treat other sites made the use of an HDR unit a more reasonable choice for centers where over 80 cervical cancer patients are treated annually. Therefore, purchase of an HDR unit is a cost-saving strategy for centers with a greater caseload.
Endometrial Cancer
Endometrial cancer is a disease in which outcomes research can be challenging; despite the high incidence of disease, the event rate (recurrence or death) is low. The result of these characteristics is that any intervention must be extremely powerful to demonstrate a statistically significant improvement in cancer specific outcomes. As such, randomized clinical trials for cases that are at low- or intermediate-risk for recurrence may take a long time to accrue and demonstration of significance may be challenging. The CER approaches, therefore, may be quite relevant in endometrial cancer. CER in endometrial cancer spans the aspects of surgical management, the use of adjuvant radiation and chemotherapy, surveillance for disease recurrence, and the evaluation and management of individuals at risk for or diagnosed with Lynch syndrome-associated cancers.
Perioperative Setting
CER techniques have been most commonly utilized in the evaluation of surgical management of endometrial cancer, and most commonly are related to the cost-effectiveness of various interventions. Given the current controversies regarding the role and expense of preoperative testing, minimally invasive surgery, and the performance of a lymphadenectomy, significant opportunities exist to utilize CER to address these perioperative issues in endometrial cancer.
Preoperative Testing
The use of preoperative imaging in patients with clinical stage I endometrial cancer has, in certain circumstances, been demonstrated to identify disease that might not be amenable to resection. While certain authors supported the strategy of preoperative CT in patients planned to undergo surgery for endometrial cancer, others questioned the effectiveness and cost of this intervention. Bansal et al. performed a study evaluating patients with endometrial cancer who underwent a preoperative CT of the abdomen and pelvis (133). In 7/250 (3%) patients over a 16-year period, the CT results led to an alteration of the surgical plan. In patients with high-risk histology (serous, clear cell, and sarcoma), the plan was changed in up to 13% of case. When the cost of imaging was incorporated into their model, the authors estimated that more than $17,000 was expended to alter the management of 1 patient. As such, the authors argued that routine preoperative CT in patients with clinical stage I endometrial cancer was not cost-effective.
Surgical Approaches to Endometrial Cancer Staging
Laparotomy versus minimally invasive surgery. Over the last few decades, minimally invasive surgery has been incorporated into the management of many malignancies, including endometrial cancer. Initial reports of this surgical approach demonstrated the feasibility and acceptable toxicity of laparoscopic staging for endometrial cancer. Subsequently, randomized trials of laparotomy versus laparoscopy were reported, including studies from the Netherlands (134), Australia (135), and the U.S. (136), all demonstrating similar oncologic outcomes between groups. Furthermore, these trials demonstrated that laparoscopy was associated with a modest improvement in quality of life compared to laparotomy (137,138). Recently, the investigators from the Netherlands evaluated the cost of treatment relative to the survival and quality of life in subjects undergoing laparotomy or laparoscopic staging of their endometrial cancer (139). These investigators suggested that despite a slightly increased cost for minimally invasive surgery (higher operative costs but lower hospital stay costs), total laparoscopic hysterectomy remains cost-effective because of the low rate of complications seen in the minimally invasive arm compared with laparotomy. While the absolute costs seen in this population may not be identical to that in other geographic regions, it is likely that trends favoring the cost-effectiveness of minimally invasive surgical staging for endometrial cancer would be similar to those in other parts of the world. This group also performed a meta-analysis of 12 trials of laparoscopic endometrial cancer surgery and reached the conclusion that laparoscopy was cost-effective compared to laparotomy (10), acknowledging that the lack of quality-of-life data precluded a definitive statement regarding the utility of this procedure from a societal perspective.
Laparoscopy versus robotic surgery. In 2006, the FDA cleared the first computer-aided (robotic) surgical system for hysterectomy. There has subsequently been a rapid incorporation of robotic surgery into gynecologic cancer practices, mainly for the treatment of endometrial cancer. Initial reports of this surgical approach demonstrated feasibility and acceptable toxicity. However, the initial purchase price of the robot (>$1 million), yearly maintenance contract (>$100,000 annually), and limited use disposable instruments add a fixed cost to this procedure over laparoscopy or laparotomy. Given the expense of robotic surgery, analyses of the cost of robotic surgery have been published, often with differing conclusions. Initially, Bell et al. described a series of patients who underwent abdominal, laparoscopic, or robotic staging for endometrial cancer, with the robotic approach being found less costly compared with laparotomy, but not significantly more expensive than laparoscopy (9). Subsequent to this report, other CER approaches have been utilized to assess the cost-effectiveness and comparative effectiveness of robotic surgery compared to other surgical approaches. Barnett et al. utilized decision modeling from the perspectives of both society and the hospital (with and without the cost of the purchase of the robot incorporated) to assess the impact of surgical approach (laparotomy, laparoscopy, and robotic) for staging of endometrial cancer (7). These authors concluded that while laparoscopy is the least expensive approach, the decreased societal cost associated with an early return to normal function makes robotic surgery less expensive than laparotomy. In sensitivity analysis, when the costs of disposable instruments and equipment are minimized to less than one-half their current cost, robotic surgery becomes the least costly approach. The modeling approach with sensitivity analyses is critically important in helping to understand the factors which drive cost in endometrial cancer surgery, and to acknowledge that the perspective from which the analysis is taken significantly impacts the conclusions that can be drawn. Additionally, a population-based CER analysis was undertaken by Wright et al. describing more than 2,400 women who underwent minimally invasive surgery for endometrial cancer, 58% robotically and 42% laparoscopically (140). These authors found similar rates of complications and an increased cost with robotic surgery, and concluded that longer term outcome data regarding robotic surgery are necessary before this approach is considered standard for the management of endometrial cancer. Collectively, the CER data regarding robotic endometrial cancer surgery suggest an increased cost, decreased morbidity compared with laparotomy, and cost-effectiveness that varies based on the perspective from which the data are interpreted.
Lymphadenectomy for surgical staging. Following two randomized trials suggesting that lymphadenectomy for endometrial cancer does not improve outcomes (141,142), the role of this procedure in the routine management of endometrial cancer has undergone increased scrutiny. Various strategies have been suggested to identify patients who are at highest risk for metastasis to the lymph nodes, and generally incorporate tumor grade, depth of myometrial invasion, histology and tumor size. Various authors have evaluated the cost-effectiveness of the strategies of routine lymphadenectomy versus a selective staging strategy. Kwon et al. suggested that as tumor grade increases, lymphadenectomy is more cost-effective than its omission, mainly due to the reduced rate of radiation in node-negative patients (143). Cohn et al. modeled grade 1 cancers and demonstrated that even in this group of patients at low risk for lymph node metastasis, routine lymphadenectomy was more cost-effective than a strategy wherein lymphadenectomy is performed selectively, assuming a lower rate of adjuvant radiation in the staged patients (144). Importantly, these authors did not include an analysis of complications or quality of life in their models. Another approach to address the role of surgical staging would be to develop a test that could predict, prior to surgery, which patients are at highest risk for the presence of lymph node metastasis. Havrilesky et al. modeled such a hypothetical test and determined that a test that could reliably predict lymph node metastasis could be cost-effective as long as it was fairly inexpensive (145). Importantly, the cost-effectiveness of such a strategy is independent of the cost of adjuvant therapy in their model.
Adjuvant radiation therapy. A number of studies have been performed analyzing the comparative cost and cost-effectiveness of adjuvant radiation in patients with endometrial cancer. Lachance et al. reported a model that included patients with stage I endometrial cancer, and evaluated strategies of observation, vaginal brachytherapy, and pelvic teletherapy (146). The authors estimated that vaginal brachytherapy would significantly reduce recurrences at an expense of almost $66,000 per survivor. While teletherapy could reduce recurrences as well, its use was associated with greater expense without an increase in survival beyond that of vaginal brachytherapy. In another study in patients with early-stage disease at intermediate risk for recurrence, Rankins et al. created a decision model demonstrating that the cost-effectiveness of adjuvant pelvic teletherapy was dependent on the risk of recurrence and the efficacy of adjuvant therapy; in the population enriched for a high risk for recurrence, radiation was cost-effective (147). These data suggest that routine adjuvant radiation for early-stage endometrial cancer is not cost-effective. However, in patients at a high risk for recurrence, this balance shifts, with adjuvant therapy becoming adequately cost-effective to recommend its use. Again, these studies are plagued by their lack of information on quality of life, specifically given the increasing data suggesting a deterioration of the quality of life domains of sexuality, urinary, and intestinal functions in patients receiving certain forms of radiation for endometrial cancer (148).
Surveillance for endometrial cancer recurrence. Given that the survival of women with endometrial cancer is approximately 85% overall, investigators have challenged the notion that routine intermittent surveillance for pelvic examination and vaginal cytology (with or without chest imaging) is cost-effective or even necessary for most women with endometrial cancer. In support of the trend toward decreased intensity of surveillance, it has been estimated that the cost of routine vaginal cytology to identify a single asymptomatic recurrence is more than $44,000 (149). Whether the identification of this asymptomatic individual leads to improved outcomes is even less certain (150).
Lynch syndrome. From clinic-based studies, it is estimated that 2.3% of patients with endometrial cancer have Lynch syndrome as the cause of their disease (151). Given the relatively low prevalence of the disease, the ability to distinguish these patients from all those with sporadic disease would be enormously beneficial, as the probands and their families could be introduced to prevention and screening interventions that might decrease the risk of dying from Lynch-related malignancies. However, the clinical Amsterdam criteria are relatively insensitive and nonspecific in identifying Lynch syndrome. Thus, many institutions have begun utilizing immunohistochemistry (IHC) for the DNA mismatch repair genes as an initial screen for Lynch syndrome. Health economic studies of this strategy have demonstrated that utilizing IHC in patients with a first-degree relative with a Lynch-associated cancer is cost-effective (152). Other investigators, while acknowledging that clinical judgment is key to the interpretation of their model, have shown that the routine use of IHC, with a subsequent triage to genetic testing if IHC is abnormal, is potentially cost-effective when compared to other screening strategies (153).
Additionally, the cost-effectiveness of strategies to prevent the disease in probands with known Lynch syndrome has been evaluated. Kwon et al. demonstrated that in this population, annual surveillance with endometrial biopsy, pelvic ultrasound, and CA-125 at 30 years plus risk-reducing hysterectomy and oophorectomy at 40 years is the most effective strategy, though substantially more expensive than preventative surgery alone or screening alone, with an additional $194,000 spent per increase in year of survival compared to the next best strategy (93). The cost-effectiveness of risk-reducing surgery has also been confirmed by Yang et al., who demonstrated that this intervention is more cost-effective than either yearly examination or yearly invasive screening for malignancy (154).
Summary
Gynecologic oncology provides a rich opportunity to investigate the comparative effectiveness of various diagnostic, therapeutic, screening, and preventative strategies. While the field is still relatively young, substantial knowledge about these strategies has been gained through CER techniques and modeling. Continued investigation with refinement of CER tools for the investigation of gynecologic cancer is needed to advance the state of knowledge.
KEY POINTS
1. Comparative effectiveness research (CER) provides the framework for studies that compare the potential harms and benefits of strategies to prevent, diagnose, or treat gynecologic malignancy.
2. Health economic studies, including cost-effectiveness and cost-utility analyses, are a subset of CER in which medical interventions are compared on the basis of their relative costs, as well as their potential harms and benefits.
3. A key factor in the development of a cost-utility model is the incorporation of quality of life, which requires a preference-based utility. The utility may be derived using a variety of quality-of-life-related instruments. Use of the utility allows the results of a model to be expressed in QALYs, which is a standard effectiveness outcome.
4. The results of health economic decision models are highly dependent on their perspective and the assumptions made in their construction.
5. Uncertainty in health economic models is best described using multiple sensitivity analyses.
6. There is a growing body of CER evidence to guide clinical and resource allocation decisions in gynecologic oncology.
Stay updated, free articles. Join our Telegram channel

Full access? Get Clinical Tree


