Clinical Pharmacokinetics in Infants and Children
Edmund V. Capparelli
Introduction
Considerable growth has occurred in the number of new chemical and biologic treatments during the last 25 years. Appropriate use of these agents in pediatric patients requires determining the safe and effective dosage for infants and children. A rational approach to determining appropriate dosage requires understanding the pharmacokinetic and pharmacodynamic properties of a drug in the population in which it is being used. Optimal therapy utilizes knowledge of a drug’s pharmacokinetics to determine the dosage with a given formulation that will achieve desired drug concentrations for a particular infant or child. In this setting, pharmacokinetics represents the mathematical description of drug movement through a pediatric patient. Pharmacodynamics describes the relationship of drug concentrations at the site of action and the magnitude of responses, both therapeutic and toxic. In simplified terms, pharmacokinetics describes what the body does to the drug, and pharmacodynamics describes what the drug does to the body (Fig. 2.1).
Knowing the right dosage for an individual is as important as selection of the correct drug. Determining the dosage for an individual patient that maximizes clinical benefit yet minimizes toxicity requires knowledge of the general pharmacokinetic and pharmacodynamic properties of the drug in the population, the variability of these properties, and important physiologic determinants of this variability. Some of the pharmacokinetic and pharmacodynamic variability may be explained by genetic-, age-, size-, and disease-related effects. Even when the sources of pharmacokinetic and pharmacodynamic variability cannot be identified, understanding the range of concentrations and responses to a dosing regimen is necessary in the development of rational treatment strategies.
The pharmacokinetics of most drugs can be well described by a few key parameters. The two most important are volume of distribution, Vd, and clearance, CL. The elimination half-life, t1/2, and associated elimination rate constant, K, are also widely determined and useful to determine dosing frequency. Following nonparenteral administration (such as oral, intramuscular, subcutaneous, or inhaled), bioavailability and absorption rate parameters are also necessary to describe a drug’s pharmacokinetic behavior. Through these pharmacokinetic parameters a dosing regimen can be derived to achieve target drug concentrations or range of concentrations where the desirable effect is likely and toxicity is minimal. Clinical pharmacodynamic parameters are often highly variable and can require study of many individuals in multiple studies to understand the exposure–effect relationship. To develop appropriate target concentrations, pharmacodynamic models that describe the maximal effect, Emax, and concentration that achieves half of the maximal effect, EC50, as either inhibitory or stimulatory influences on disease processes can be used. Methods for calculating these parameters and clinical (physiologic and pathologic) factors that affect them are presented in this chapter.
Volume of Distribution
After a drug is administered, it does not stay confined in the circulating blood pool. The drug diffuses into tissues, organs, and other fluid spaces, where it exerts its actions. However, when measuring drug concentrations, we are usually limited to collecting serum or plasma samples from the circulating blood pool and determining drug concentrations in these matrices. This serves as a surrogate for the drug concentration at the site of action. Therefore, it is useful to relate drug concentration measured in plasma to total amount of drug in the body. The volume of distribution, Vd, is a proportionality constant that relates the drug concentration to the total amount of drug in the body and can be represented as
where A is the total amount of drug in the body and Cp is the drug concentration in plasma. The direct clinical
application of this pharmacokinetic parameter is that it can determine a loading dose:
application of this pharmacokinetic parameter is that it can determine a loading dose:
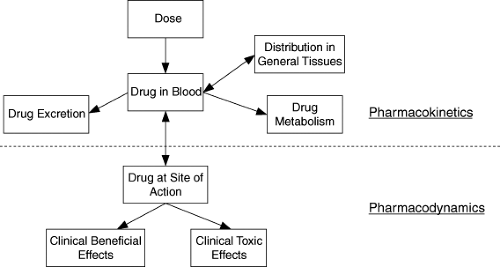 Figure 2.1. Schematic representation of the components that make up the pharmacokinetic–pharmacodynamic interface. |
It can be defined in relation to blood concentrations, plasma or serum concentrations, or unbound concentrations (Vdb, Vdp, Vdu, respectively). For a given drug, each of these drug concentration measurements may have different values; thus, Vd is relative to the matrix from which concentrations were measured. If, after bolus administration, a drug instantaneously equilibrates between plasma and tissues, Vdp can easily be estimated as
where Cp0 is the drug concentration in plasma at time zero or immediately after drug administration (Fig. 2.2). This represents a one-compartment model. Distribution of drug out of blood and into other fluids and tissues takes time; so “true” one-compartment drug behavior is almost never encountered. However, if distribution is very rapid relative to elimination or absorption (following oral administration), a one-compartment model can adequately describe the drug distribution. More commonly, after intravenous administration, a rapid fall in drug concentrations is followed by a slower disappearance of drug. This multiphasic pattern of drug concentrations requires more complicated models and calculation methods. The most common model in this situation is the two-compartment model (Fig. 2.3). In this setting, drug concentrations initially fall rapidly because of distribution of the drug out of blood into tissues followed by a slower decline because of elimination. The initial distribution phase is also known as the alpha phase and the elimination period as the beta (β) phase. It is important to recognize that these do not represent true physical tissue or fluid spaces per se but are greatly influenced by body composition, physiologic processes, and the chemical and physical properties of the drug. Therefore, a drug that has a much higher affinity for extravascular tissue than for plasma may have a Vd that is in excess of true body size (greater than 1 L per kg). However, it is possible to set a minimum value for Vd at the blood or plasma volume. Thus, no drug can have a Vd less than total intravascular plasma volume, or about 50 mL per kg. In multiple-compartment models, various methods can be used to calculate Vd. A common approach is to estimate Vd from the terminal beta phase; it is calculated as follows:
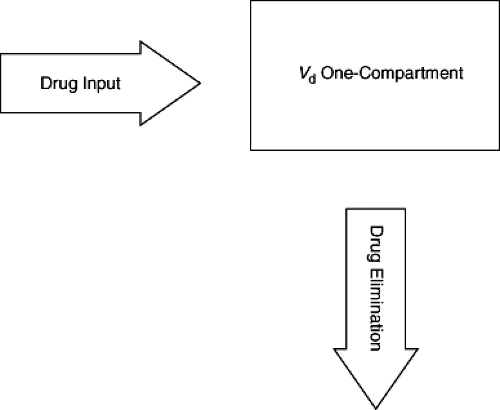 Figure 2.2. Basic one-compartment model. |
where AUC is the area under the concentration–time curve after a single dose. An alternative method used to calculate Vd is the noncompartmental approach. With this method, Vd is defined as Vd at steady state, Vdss; this is calculated using the following equation:
where AUMC is the area under the first moment curve (concentration ÷ time vs. time). The related fraction
AUMC/AUC equals the mean time that drug molecules remain in the body and is referred to as the mean residence time (MRT). From a theoretical basis, Vdss = Vdc1 + Vdc2, where c1 and c2 are the central and peripheral compartments, respectively. Although this method has the advantage of being relatively independent of terminal-slope determination, it requires a much longer sample collection duration to characterize the AUMC from the first moment curve (because this curve is less “steep” than the concentration vs. time curve, Fig. 2.4). It also requires estimating an absorption input parameter (mean absorption time, MAT) as a correction factor when estimating Vd for drugs that are not administered as an intravenous bolus.
AUMC/AUC equals the mean time that drug molecules remain in the body and is referred to as the mean residence time (MRT). From a theoretical basis, Vdss = Vdc1 + Vdc2, where c1 and c2 are the central and peripheral compartments, respectively. Although this method has the advantage of being relatively independent of terminal-slope determination, it requires a much longer sample collection duration to characterize the AUMC from the first moment curve (because this curve is less “steep” than the concentration vs. time curve, Fig. 2.4). It also requires estimating an absorption input parameter (mean absorption time, MAT) as a correction factor when estimating Vd for drugs that are not administered as an intravenous bolus.
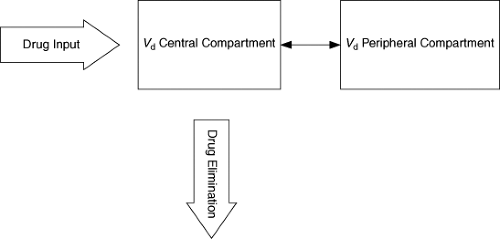 Figure 2.3. Basic two-compartment model. Drug distributes between central and peripheral compartments and is eliminated from central compartment. |
Although the volume of distribution does not represent a true physical space, changes in body composition seen throughout infancy and childhood can have a predictable impact on the volume of distribution based on a drug’s chemical and physical properties. Newborn infants have a higher proportion of extracellular and total body water than older populations, and thus drugs that are distributed freely in water have larger volumes of distribution in newborns. Accordingly, aminoglycoside antibiotics, which are highly polar and hydrophilic and are distributed primarily into extracellular fluid, have approximately double the volume of distribution in newborns as in adults. Preterm newborns have a reduced percentage of total body fat. Thus, for lipophilic drugs, the volume of distribution may be reduced compared to that in adults.
 Figure 2.4. Concentration versus time and first moment curve (concentration ÷ time vs. time) for a drug exhibiting pronounced multicompartment pharmacokinetics. Ninety percent of the area under the concentration-versus-time curve (AUC) can be captured with sampling out to 36 hours. To characterize the same portion of the first moment curve (AUMC) requires collecting samples nearly twice as long. |
Differences in drug binding across age groups can affect its Vd. Whereas drugs can bind to tissue components and plasma proteins, only the free (unbound) drug equilibrates. Thus, in newborns and certain diseases in which albumin and alpha-1 acid glycoprotein levels are low, highly bound drugs will have a greater free-fraction (unbound/total drug concentration) in plasma, and more drug will distribute out of the plasma compartment into tissues. This will have the net effect of a higher Vd for total drug, although the Vdu may be similar. While free drug concentrations may be more representative of the “effective” concentration seen at the site of action, they are not routinely measured because their measurements require more sensitive, time consuming, expensive assays.
In most clinical situations, alterations in protein binding will not have a significant impact on therapy but can greatly impact the interpretation of measured (total) drug concentrations.
In most clinical situations, alterations in protein binding will not have a significant impact on therapy but can greatly impact the interpretation of measured (total) drug concentrations.
Distribution into Specific Tissues
When acute drug effects are of critical importance, such as in induction of anesthesia or in treatment of shock, the distribution characteristics of a drug are integral to its therapeutic utility. In general, distribution characteristics for drugs used in the treatment of chronic diseases are of lesser clinical importance. One important exception relates to target sites that a drug may not access easily. Whereas most distribution is based on concentration gradients and passive diffusion, in some tissues drug access is limited by tight junctions in the endothelium and active drug transport. For many drugs, free concentrations do not come into true equilibrium within the central nervous system due to these processes. P-glycoprotein and other active transporters pump various drugs out of the central nervous system and greatly reduce the overall effective penetration into this site.
Clearance
Drug clearance (CL) is a measure of drug elimination. It represents the volume of blood or plasma from which drug is completely removed per unit of time. It is analogous to creatinine clearance as an assessment of renal function. It is the ratio of the rate of elimination or extraction divided by the drug concentration and can be mathematically defined as
At steady state, where by definition drug input equals drug elimination, this equation can be rearranged to
Thus, CL dictates the average steady-state concentration, Cpave, that will be achieved from a given dosing regimen. It can also be expressed in terms of mass balance for the organ of elimination. The rate of drug clearance from an eliminating organ is the product of the blood flow, Q, and the extraction ratio (ER) from arterial blood of that organ. An organ’s ER is determined from arterial concentration, CpA, reaching the organ and venous concentration, CpV, leaving the organ of elimination and can be expressed as
It can range from 0 (no extraction) to 1 (complete extraction). An important mathematical property regarding CL is that it can be separated into its individual components. The two most common organs of drug elimination are the liver and the kidney. The liver metabolizes drugs and can also excrete drugs and drug metabolites in bile. The kidney filters and excretes drugs and drug metabolites. Occasionally, other tissues contribute significantly to a drug’s clearance. Therefore, overall CL can be expressed as
For most drugs, CL is constant over the range of concentration encountered clinically. When a drug’s CL is independent of concentration, the elimination is referred to as first-order. In this setting, there is a linear relationship between the logarithm of drug concentration and time during drug elimination. With first-order elimination, changes in dosing lead to proportional changes in drug concentrations. Clearance can be estimated by model-based methods through fitting the observed concentration versus time profile to an appropriate model. Following intravenous administration, CL (and Vd) can be determined using a one-compartment model through iterative fitting of drug concentrations to the following equation:
Alternatively, CL can be estimated using noncompartmental methods from the area under the concentration versus time curve (AUC). The AUC can be approximated following intensive sampling using the trapezoidal method. This is the summation of the area of trapezoids estimated from sequential, intensively collected plasma concentrations with the area of each individual trapezoid equal to [(Cpi + Cpi+1)/2](ti+1 – ti) and the final area after the last trapezoid can be estimated as Cp-last/λz, where λz is the terminal slope of the log plasma concentration versus time curve. From the AUC, the CL following a single intravenous dose can be calculated as
Clearance may also be defined with respect to unbound drug concentrations. For drugs with protein binding, unbound drug concentrations are always less than the total drug concentrations, and thus AUC for unbound drug concentration is always lower than AUC for total drug concentration. Because clearance is inversely related to AUC, the calculated clearance for unbound drug is greater than that for total drug.
Renal Clearance
Many drugs undergo elimination into the urine by the kidneys. This occurs via filtration through the glomerulus and active secretion of acids and bases, which occurs primarily in the proximal tubule. Typically, only free or unbound drugs are filtered by the glomerulus into the urine. Separate active transport systems exist for acid (anion) and base (cation) secretion by the kidneys. Drug elimination by filtration and active secretion can be mitigated by reabsorption of the drug along the proximal and distal tubules as well as the collecting duct. Reabsorption is primarily a passive process; however, its impact can be pronounced.
Because the great majority of water that is filtered by the glomerulus is reabsorbed, drugs with favorable physical-chemical properties (small, nonpolar) will follow the water and be reabsorbed as well. The reabsorption of drugs with pKa values in the range of urinary pH can be markedly influenced by acidification or alkalinization of urine. Mathematically, renal clearance equals renal excretion rate divided by average plasma concentration and can be determined from serial blood and urine collections using the equation:
Because the great majority of water that is filtered by the glomerulus is reabsorbed, drugs with favorable physical-chemical properties (small, nonpolar) will follow the water and be reabsorbed as well. The reabsorption of drugs with pKa values in the range of urinary pH can be markedly influenced by acidification or alkalinization of urine. Mathematically, renal clearance equals renal excretion rate divided by average plasma concentration and can be determined from serial blood and urine collections using the equation:
where Ae is the cumulative drug excreted unchanged in the urine and AUC is derived from the plasma concentration-versus-time profile.
Glomerular filtration rates (GFR) are commonly estimated from serum creatinine in adults and used to individualize dosing of drugs eliminated by renal mechanisms. While GFR can be estimated from serum creatinine in children also, the relationship between measured serum creatinine and GRF is different between pediatric and adult populations. Age-specific equations have been developed for estimating GFR in pediatric populations; however, lower serum creatinine concentrations in children reduce the precision of these equations. In newborn infants, estimating the GFR from serum creatinine is confounded by the transplacental creatinine that infants receive from their mothers in utero. This additional maternally derived creatinine may bias estimates of GFR in newborns during the first few days of life.
Hepatic Clearance
The liver is the primary site of drug metabolism. Drug biotransformation is influenced by a drug’s chemical and structural properties, which determine its affinity to various drug-metabolizing enzymes in the liver. Drug metabolism may also be influenced by hepatic blood flow and protein binding. Drugs with a great affinity for metabolizing enzymes are highly extracted and their metabolism is limited primarily by hepatic perfusion. Their hepatic clearance approaches and parallels hepatic blood flow. Changes in hepatic blood flow have much less impact on the clearance of those drugs with lower affinity for metabolizing enzymes or low hepatic extraction. However, for low-hepatic-extraction drugs, their total hepatic clearance is sensitive to changes in protein binding. Hepatic clearance of unbound drug can be used as a measure of the liver’s overall ability to metabolize that drug. Hepatic clearance of unbound drug is also frequently referred to as intrinsic clearance, CLhu. It is mathematically related to total hepatic clearance, CLh, by multiplying with the fraction unbound:
Understanding the hepatic extraction of a compound aids in determining the impact that patient-specific factors, including age, liver disease, and cardiac status, may have on hepatic clearance.
Saturable Elimination
In some instances, CL is not independent of drug concentration, as the metabolizing enzyme or secretory pump gets overwhelmed by excessive drug. This is often referred to as nonlinear or Michaelis-Menten elimination. It is mathematically expressed as
Stay updated, free articles. Join our Telegram channel

Full access? Get Clinical Tree


