Electrocardiography is critical in the diagnosis of electrical disorders of the heart. It may serve as a useful screening tool in the evaluation of patients with suspected structural defects or abnormalities of the myocardium.
Newborns have a large variability in electrocardiogram (ECG) voltages and intervals due in large part to hemodynamic and myocardial adaptations that are needed once the placenta is no longer part of the circulatory system.
Changes continue, albeit at a slower pace, from infancy through adolescence.
Algorithms used to interpret ECGs in adults cannot be used in children. This section is a basic, although incomplete, guide to the pediatric ECG.
The usual recording speed is 25 mm/sec; each little box (1 mm) is 0.04 seconds and each big box (5 mm) is 0.2 seconds.
With a fast heart rate, count the R-R cycles in 6 large boxes (1.2 seconds) and multiply by 50.
With a slow heart rate, count the number of large boxes between R waves and divide into 300 (1 box = 300, 2 boxes = 150, 3 boxes = 100, 4 boxes = 75, 5 boxes = 60).
Table 14-1 lists normal heart rates.
Are the QRS deflections regular? Variation in the rate up and down in concert with respirations (sinus arrhythmia) is normal and can be pronounced in young healthy hearts.
Irregular QRS pattern suggests the possibility of an atrial arrhythmia. With pauses and narrow QRS, look for evidence of atrial premature contractions with P waves of different appearance and/or axis as compared with sinus beats. The early P wave may not conduct, leading to longer pauses (blocked atrial premature contractions).
The QRS may be prolonged if conduction down the atrioventricular (AV) node is delayed (aberrant conduction). Wide QRS complexes with pauses may represent premature contractions from a ventricular focus, especially if the T-wave morphology is also altered with the opposite axis.
Look for a P wave before each QRS at an expected interval, usually between 100 and 150 ms. The P wave should be upright in I and aVF for the typical location of sinus node. The sinus P wave is up in leads I, II, aVF, pure negative in aVR, and usually biphasic in lead V1—first positive, then negative:
Inverted P waves (leads II, III, and aVF) with slower heart rates indicate a low atrial rhythm and are a normal finding.
Inverted P waves associated with tachycardias are abnormal and may be ectopic atrial tachycardia or other forms of supraventricular tachycardia (SVT).
TABLE 14-1 Normal Heart Rates in Children* | ||||||||||||||||||||||
|---|---|---|---|---|---|---|---|---|---|---|---|---|---|---|---|---|---|---|---|---|---|---|
| ||||||||||||||||||||||
The PR interval represents atrial depolarization.
Table 14-2 lists the mean and upper limits of normal PR intervals by age and heart rate.
The QRS axis shows the direction of ventricular depolarization.
Left axis deviation can suggest left ventricular hypertrophy or left bundle branch block (LBBB).
Right axis deviation can suggest right ventricular hypertrophy or right bundle branch block (RBBB).
Table 14-3 gives the mean QRS axis values by age.
The QRS duration represents ventricular depolarization. Normal times for depolarization depend on age. A prolonged QRS may indicate bundle branch block, hypertrophy, or arrhythmia.
Table 14-4 lists the normal QRS durations by age.
The ECG is only a screening tool for hypertrophy, with high false-negative and falsepositive rates, especially in infants. The QRS axis shifts toward the hypertrophied ventricle.
In children >3 years of age, the usual QRS is between 20 and 120 degrees. The QRS voltage changes increase in leads toward which the electrical depolarization is directed and decrease in leads in the opposite direction.
In right ventricular hypertrophy, increased R waves may be present in V1 with an increased R/S ratio in V1 and decreased R/S ratio in V6. An upright T wave in V1 between 7 days and 7 years of age is also suggestive of right ventricular hypertrophy.
In left ventricular hypertrophy, increased R waves may be present in V5, V6, I, II, III, or aVF. The R/S ratio may be decreased in V1 or V2. Inverted T waves in I, aVF, V5, or V6 suggest a “strain” pattern, indicating abnormal repolarization.
TABLE 14-2 Normal PR Intervals | |||||||||||||||||||||||||||||||||||||||||||||||||||||||||||||||||||||||||||||||||||||||||||||||||||
|---|---|---|---|---|---|---|---|---|---|---|---|---|---|---|---|---|---|---|---|---|---|---|---|---|---|---|---|---|---|---|---|---|---|---|---|---|---|---|---|---|---|---|---|---|---|---|---|---|---|---|---|---|---|---|---|---|---|---|---|---|---|---|---|---|---|---|---|---|---|---|---|---|---|---|---|---|---|---|---|---|---|---|---|---|---|---|---|---|---|---|---|---|---|---|---|---|---|---|---|
| |||||||||||||||||||||||||||||||||||||||||||||||||||||||||||||||||||||||||||||||||||||||||||||||||||
TABLE 14-3 Normal QRS Axis Ranges by Age | ||||||||||||||
|---|---|---|---|---|---|---|---|---|---|---|---|---|---|---|
| ||||||||||||||
In RBBB, late depolarization in the right ventricle leads to rightward QRS axis as well as a widened QRS with wide and slurred S in I, V5, and V6. R′ is slurred in aVR, V1, and V2. (Last activated chamber is anterior and rightward.)
In LBBB, late depolarization in the left ventricle leads to leftward QRS axis and widened QRS with slurred and wide R waves in I, aVL, V5, and V6. Wide S waves are seen in V1 and V2. Q waves may be absent in I, V5, and V6. (Last activated chamber is posterior and leftward.)
In the setting of bundle branch blocks, the usual criteria for ventricular hypertrophy do not apply.
Long QT syndrome is an important cause of sudden death. Determination of the QT interval is important, especially in patients with syncope or seizures (see “Channelopathies” below).
The QT interval is measured in milliseconds (usually in lead II, V5, or V6; do not use leads V1-V3 as there are often U waves in these leads, which can skew measurements) from the start of the QRS complex to the end of the T wave.
The U wave, which may occur after the T wave, should be included only if it is at least one half the amplitude of the T wave.
The QT interval is adjusted for heart rate (QTc) by dividing by the square root of the preceding RR interval:

The QTc is usually <0.44 seconds (95th percentile).
Patients with long QT syndrome may also have unusual T-wave morphologies, including notched, bifid, or biphasic T waves.
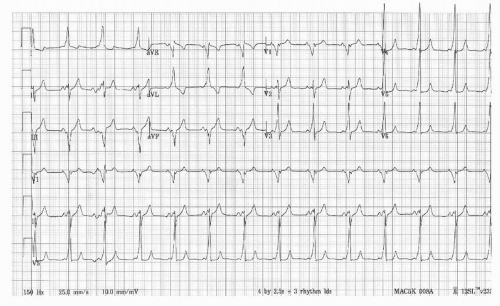
Figure 14-1 shows an ECG of a teenage patient with a presenting complaint of seizures.
TABLE 14-4 Normal QRS Duration | ||||||||||||||||||||||||||||||||||||
|---|---|---|---|---|---|---|---|---|---|---|---|---|---|---|---|---|---|---|---|---|---|---|---|---|---|---|---|---|---|---|---|---|---|---|---|---|
| ||||||||||||||||||||||||||||||||||||
Arrhythmias other than sinus abnormalities are uncommon in children.
Children with congenital heart disease or heart surgery are more likely to have arrhythmias.
This section presents the basic presentation and therapy of arrhythmias in children, but it is not a complete description.
Palpitations, syncope, and shock
Complaints of heart racing or fluttering
Syncope occurring in the midst of exercise
Abrupt syncope with no premonitory symptoms
Prior history of congenital heart disease or heart surgery
Brought on by sudden startle such as alarm clock without preceding symptoms; think long QT syndrome or other channelopathy
Possible murmur, irregular rhythm, tachycardia, hypotension, or poor oxygen saturation
Edema and poor perfusion in the extremities if in heart failure or shock
Possible loss of consciousness
The differential diagnosis of tachycardia starts with determining whether the tachycardia is regular or irregular and the width of the QRS.
Narrow complex regular tachycardia
P before QRS (AKA: long RP tachycardia):
Sinus tachycardia
Ectopic atrial tachycardia (regular)
Persistent junctional reciprocating tachycardia (very slow SVT)
P within QRS
AV node reentry tachycardia: uncommon in children <2 years of age but typical in teenagers
Junctional ectopic tachycardia: typically occurs postoperatively, after congenital heart surgery
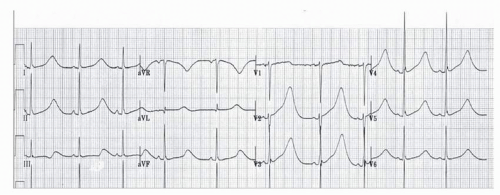
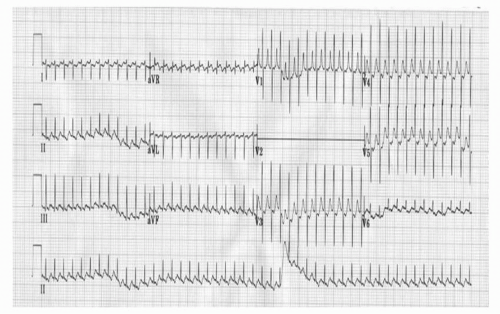
P behind QRS: reentry pathway (Fig. 14-2):
Occurs especially with pre-excitation when the patient is in sinus rhythm (Wolff-Parkinson-White [WPW] syndrome) (Fig. 14-3)
Can present at any age
More Ps than QRSs
Atrial flutter
Ectopic atrial tachycardia (regular)
Coarse atrial fibrillation (“fib-flutter”)
Narrow complex irregular tachycardia
Atrial fibrillation
Ectopic atrial tachycardia (irregular)
Atrial flutter with variable AV conduction
Wide complex regular tachycardia
Usually ventricular tachycardia
Ventricular > atrial depolarizations, which are diagnostic
1:1 Ventricular: atrial depolarizations unusual
SVT (any type) with aberrancy or preexisting bundle branch block
Antidromic reentry pathway (atrium to ventricle down WPW pathway and ventricle to atrium via AV node)
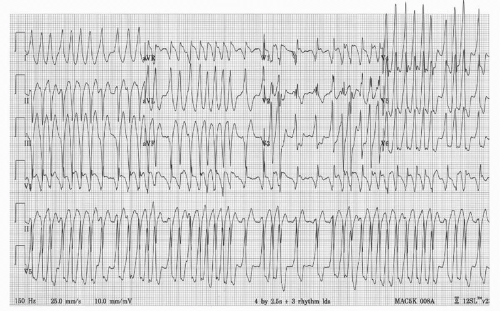
Wide complex irregular tachycardia (Fig. 14-4):
Ventricular fibrillation/fast polymorphic ventricular tachycardia
Torsades de pointes
Atrial fibrillation with WPW
Ectopic atrial tachycardia, irregular, with aberrancy
 Figure 14-3 Electrocardiogram showing a sinus rhythm with preexcitation from a pathway that causes depolarization of some of the ventricular mass before depolarization through the usual delay via the atrioventricular node (Wolff-Parkinson-White syndrome). The delta waves are seen at the start of the QRS complex leading to a short PR interval. This tracing could be from the patient in Figure 14-2. |
Do not forget ABCs.
Assess the hemodynamic status of the patient.
Attach monitor/defibrillator leads.
Give oxygen.
Probable narrow complex regular SVT (heart rate usually >220 beats per minute in infants and >180 beats per minute in children):
Consider vagal maneuvers, but do not delay further treatment.
Give adenosine rapid IV push dose of 0.1 mg/kg up to 6 mg.
Record hard-copy ECG during treatment.
If the first dose is not effective, repeat using dose of 0.2 mg/kg up to 12 mg (maximum adult [teenager] dose).
Wide complex tachycardia: unconscious patient who is in shock
Use synchronized cardioversion at 0.5-1 J/kg.
If not effective, repeat cardioversion with 2-4 J/kg.
Wide complex, regular tachycardia: awake but unstable patient
A trial of adenosine may be considered.
If hemodynamically unstable but awake, consider sedation for synchronized cardioversion, but do not delay if the patient is deteriorating.
Specific cardiac ion channel abnormalities predispose patients to arrhythmias and sudden death (Silva et al.).
Long QT syndrome
Inherited channelopathy that prolong ventricular repolarization
Prevalence 1:2,000 live births
Predisposes patients to syncope (especially with stress) or sudden cardiac death
Typically manifest as QTc >450 ms in males and >460 ms in females on ECG (Fig. 14-1)
Stay updated, free articles. Join our Telegram channel

Full access? Get Clinical Tree


