American Academy of Pediatrics
American Academy of Pediatric Dentistry
American Academy of Periodontology
American Association of Critical-Care Nurses
American College of Critical Care Medicine
American College of Emergency Physicians
American Nurses Association
American Society for Gastrointestinal Endoscopy
American Society of Anesthesiologists
American Society of Plastic and Reconstructive Surgeons
Association of Operating Room Nurses
Emergency Nurses Association
Joint Commission on Accreditation of Healthcare Organizations
National Institutes of Health
Society of Gastroenterology Nurses and Associates
Society of Nuclear Medicine
At each hospital accreditation survey, the Joint Commission will evaluate whether clinicians practice procedural sedation and analgesia consistent with their hospital-wide sedation policy, and whether they provide sufficient documentation for such compliance. Physicians must be familiar with their hospital’s sedation policies, and should work with their medical staff to ensure that such policies are suitably detailed. Most hospitals pattern their sedation policies after the Joint Commission standards and definitions.
The Joint Commission requires that practitioners who are permitted to administer deep sedation must be qualified to rescue patients from general anesthesia. Moderate sedation suffices for the majority of procedures in cooperative children, although it will not be adequate for extremely painful procedures, or in uncooperative patients. Deep sedation can facilitate these, but at greater risk of cardiorespiratory depression than moderate sedation [3, 5] (Table 6.2).
Minimal sedation (anxiolysis) [7] | A drug-induced state during which patients respond normally to verbal commands |
Although cognitive function and coordination may be impaired, ventilatory and cardiovascular functions are unaffected | |
Moderate sedation (formerly “conscious sedation”) [7] | A drug-induced depression of consciousness during which patients respond purposefully to verbal commands, either alone or accompanied by light tactile stimulation |
Reflex withdrawal from a painful stimulus is not considered a purposeful response | |
No interventions are required to maintain a patent airway, and spontaneous ventilation is adequate | |
Cardiovascular function is usually maintained | |
A trance-like cataleptic state induced by the dissociative agent ketamine characterized by profound analgesia and amnesia, with retention of protective airway reflexes, spontaneous respirations, and cardiopulmonary stability | |
Deep sedation [7] | A drug-induced depression of consciousness, during which patients cannot be easily aroused but respond purposefully following repeated or painful stimulation |
The ability to independently maintain ventilatory function may be impaired | |
Patients may require maintaining a patent airway and spontaneous ventilation may be inadequate | |
Cardiovascular function is usually maintained | |
General anesthesia [7] | A drug-induced loss of consciousness during which patients are not arousable, even by painful stimulation |
The ability to independently maintain ventilatory function is often impaired | |
Patients often require assistance in maintaining a patent airway. Positive pressure ventilation may be required because of depressed spontaneous ventilation or drug-induced depression of neuromuscular function | |
Cardiovascular function may be impaired |
Observational Monitoring
Physiological monitoring has two components: observational monitoring by a designated clinician and electronic monitoring with mechanical monitoring devices. The most important element of procedural sedation and analgesia monitoring is close and continuous patient observation by an individual capable of recognizing adverse events. This person must be able to continuously observe the patient’s face, mouth, and chest wall motion, and equipment or sterile drapes must not interfere with such visualization. This careful observation will allow prompt detection of adverse events such as respiratory depression, apnea, airway obstruction, emesis, and hypersalivation [6]. An individual with advanced life-support skills should be immediately available in all settings where deep sedation is performed.
During deep sedation, the individual dedicated to patient monitoring should be experienced with this depth of sedation and have no other responsibilities that would interfere with the required advanced level of monitoring and documentation. Individual hospital-wide sedation policies may have additional requirements for how and when deep sedation is administered based on their specific needs and available resources.
Vital signs should be measured at individualized intervals including at baseline, after drug administration, on completion of the procedure, during early recovery, and at completion of recovery. During deep sedation, vital signs should be assessed every 5 min. In addition to recording vital signs at set intervals, clinicians must be especially vigilant during key phases of the sedation. Patients are usually at highest risk of complications 5–10 min following administration of IV medications and during the immediate post-procedure period when external stimuli are discontinued.
Electronic Monitoring
The use of electronic monitoring has greatly enhanced the safety of procedural sedation and analgesia. Continuous oxygenation (pulse oximetry with an audible signal), ventilation (capnography), and hemodynamics (blood pressure and electrocardiogram [ECG]) can all be monitored noninvasively in spontaneously breathing patients.
Oxygenation Monitoring
Pulse oximetry is the noninvasive measurement of the percent of hemoglobin bound to oxygen providing a continuous means of estimating in real time the arterial oxygen saturation. The underlying principles of oximetry were developed in 1932 based on the Beer–Lambert law (the concentration of an unknown solute dissolved in a solvent can be determined by light absorption). Modern pulse oximetry technology, using optical plethysmography and spectrophotometry, was invented in 1974 and completed in 1980 with the addition of a probe and a miniaturized computer in the monitor [7]. The probe, consisting of red and infrared (IR) light sources and a photoelectric detector, is positioned across a pulsatile vascular bed such as the finger, the foot, or the ear lobe [7, 8].
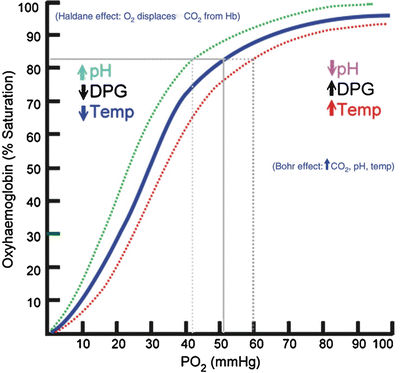
The most common type of oximetry (i.e., transmission oximetry) places the light sources on one side of the tissue bed and the photodetector on the opposite side. The pulsatile variation of the emitted red and IR light transmitted through the tissue bed is accessed by the oximeter, which divides the signal into an arterial blood pulsatile component and a nonpulsatile component (venous and capillary blood). Data averaged over several arterial pulse cycles are represented as the oxygen saturation (SpO2) [7–9]. There is a tight correlation between the arterial hemoglobin oxygen saturation (PaO2) and the SpO2 in a nonlinear fashion as described by the oxyhemoglobin dissociation curve (Fig. 6.1) [8–10]. The shape of the curve has important clinical implications. In the hypoxic patient, small changes in SpO2 on the steep part of the curve result in large changes in the PaO2, while SpO2 values at high levels of oxygenation (on the plateau of the curve) are relatively insensitive at detecting significant changes in PaO2.


Fig. 6.1
Oxyhemoglobin dissociation curve
Patients with normal lung function and adequate gas exchange have an SpO2 between 97 and 100 %. Pulse oximeters are accurate for saturations >70 % [10]. When SaO2 falls below 95 %, hypoxia may be present, although patients with obstructive lung disease may live in this range [8, 9]. Oxygen saturations below 90 % represent significant hypoxia. At 75 % saturation, oximetry bias is uniformly scattered (7 % underestimation and 7 % overestimation).
The finger is the most common probe site used for pulse oximetry. If the finger is inaccessible or unsuitable, other probe sites, such as the ear lobe or the bridge of the nose, may be used. In neonates and infants, probe sites include the great toe, the heel, the sole, and the lateral aspect of the foot.
There are a number of important limitations to the accuracy of pulse oximetry: poor perfusion secondary to severe vasoconstriction (e.g., low perfusion states, shock, hypothermia), artifact from excessive patient motion, severe anemia, high-intensity ambient light, abnormal hemoglobins, venous pulsations, synthetic fingernails and nail polish, or intravenous dyes [8, 10]. Recent advances in motion control technology have made pulse oximetry more reliable during patient motion. Carboxyhemoglobin (COHb) and methemoglobin (MetHb) contribute to light absorption and cause errors in saturation readings. The oximeter sees COHb as though it were mostly OxyHb and gives a false high reading. In the presence of high levels of MetHb, the SpO2 is erroneously low when the arterial saturation is above 85 % and erroneously high when the arterial saturation is below 85 %. MetHb produces a large pulsatile absorbance signal at both the red and IR wavelengths. This forces the absorbance ratio toward unity, which corresponds to an SpO2 of 85 %. Further, in dark-skinned patients, false high readings and a higher incidence of failure of signal detection have been reported [8–10].
Pulse oximetry is not a substitute for ventilation monitoring, as there is a lag time—the extent of the lag depending on the age and physical status of the patient—between the onset of hypoventilation or apnea and a change in oxygen saturation. Therefore, during procedural sedation, ventilation monitoring should always accompany oxygenation monitoring. Hypoventilation and resultant hypercapnia may precede a decrease in hemoglobin O2 saturation by minutes [11]. Further, supplemental O2 may mask hypoventilation by delaying the eventual O2 desaturation for which pulse oximetry monitoring is designed to recognize [12].
Ventilation Monitoring
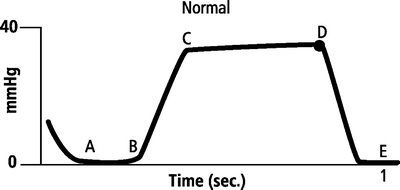
Capnography is the noninvasive measurement of the partial pressure of carbon dioxide in exhaled breath represented as a numerical value (end-tidal CO2) and a waveform. The CO2 waveform or capnogram represents changes in the CO2 concentration over the time of one respiratory cycle (Fig. 6.2) [13]. Changes in the shape of the waveform are diagnostic of disease conditions, while changes in end-tidal CO2 (EtCO2—the maximum CO2 concentration at the end of each tidal breath) can be used to assess disease severity and response to treatment [14].


Fig. 6.2
Normal CO2 waveform
Modern capnography was developed in the 1940s and commercialized in the 1960s and 1970s with the development of mass spectroscopy. Capnography became a routine part of anesthesia practice in Europe in the 1970s and in the United States in the 1980s [13]. Most capnography technology is built on infrared (IR) radiation techniques and based on the fact that CO2 molecules absorb IR radiation at a specific wavelength, with the amount of radiation absorbed having a close to exponential relation to the CO2 concentration present in the breath sample. Detecting changes in IR radiation levels with photodetectors allows for the calculation of the CO2 concentration in the gas sample.
Carbon dioxide monitors measure gas concentration or partial pressure using one of two configurations: mainstream or sidestream. Mainstream devices measure CO2 directly from the airway, with the sensor located on the endotracheal tube. Sidestream devices measure CO2 by aspirating a small sample from the exhaled breath through tubing to a sensor located inside the monitor. Mainstream systems, as the sensor is located on the endotracheal tube, are configured for intubated patients. Sidestream systems, as the sensor is located inside the monitor, are configured for both intubated and non-intubated patients. The airway interface for intubated patients is an airway adapter placed on the hub of the endotracheal tube; and, for spontaneously breathing patients, a nasal–oral cannula that allows concomitant CO2 sampling and low-flow oxygen delivery.
Sidestream systems can be either high flow (with 150 cc/min as the amount of CO2 in the breath sample required to obtain an accurate reading) or low flow (50 cc/min). Low-flow sidestream systems have a lower occlusion rate (from moisture or patient secretions) and are more accurate in patients with low tidal volumes (neonates, infants, and patients with hypoventilation and low tidal volume breathing) [15]. In high flow systems, when the tidal volume of the patient drops below 150 cc (i.e., the flow rate of the system), the monitor will entrain room air to compensate, falsely diluting the EtCO2 [16–18].
The CO2 waveform, corresponding to a single breath, consists of four phases [2, 15]. Phase 1 (dead space ventilation, A–B) represents the beginning of exhalation where the dead space is cleared from the upper airway. Phase 2 (ascending phase, B–C) represents the rapid rise in CO2 concentration in the breath stream as the CO2 from the alveoli reaches the upper airway. Phase 3 (alveolar plateau, C–D) represents the CO2 concentration reaching a uniform level in the entire breath stream and concludes with a point of maximum CO2 concentration (EtCO2). Phase 4 (D–E) represents the inspiratory cycle where the CO2 concentration drops to zero as atmospheric air enters the airway (Fig. 6.2). A normal waveform is characterized by four distinct phases, a CO2 concentration that starts at zero and returns to zero (i.e., there is no rebreathing of CO2), and a maximum CO2 concentration reached with each breath (i.e., EtCO2).
Patients with normal lung function have a characteristic rectangular-shaped waveform and a narrow EtCO2–pCO2 gradient (0–5 mmHg), with the EtCO2 accurately reflecting the PaCO2 [14, 19]. Patients with obstructive lung disease will have a more rounded ascending phase and an upward slope in the alveolar plateau (Fig. 6.3) [20]. In patients with abnormal lung function secondary to ventilation–perfusion (V–Q) mismatch, the gradient will widen, depending on the severity of the lung disease [21–23].


Fig. 6.3
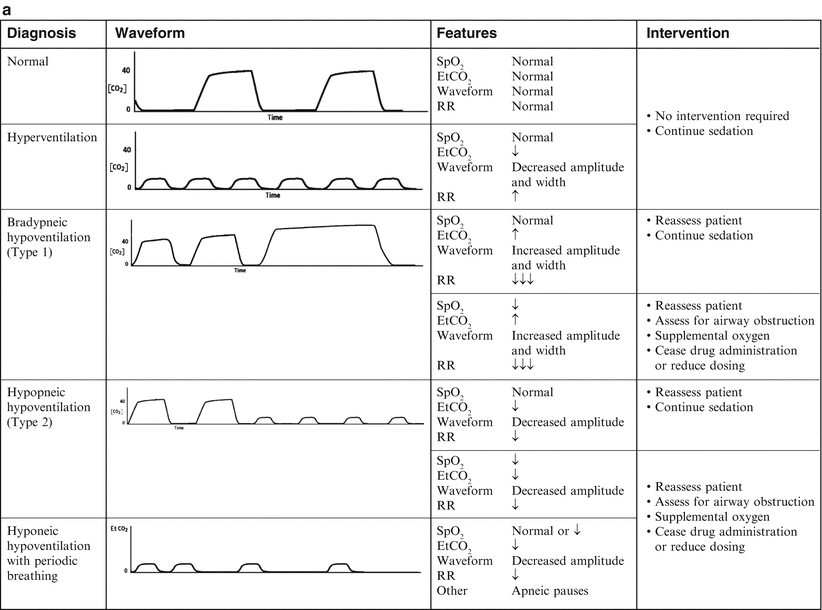
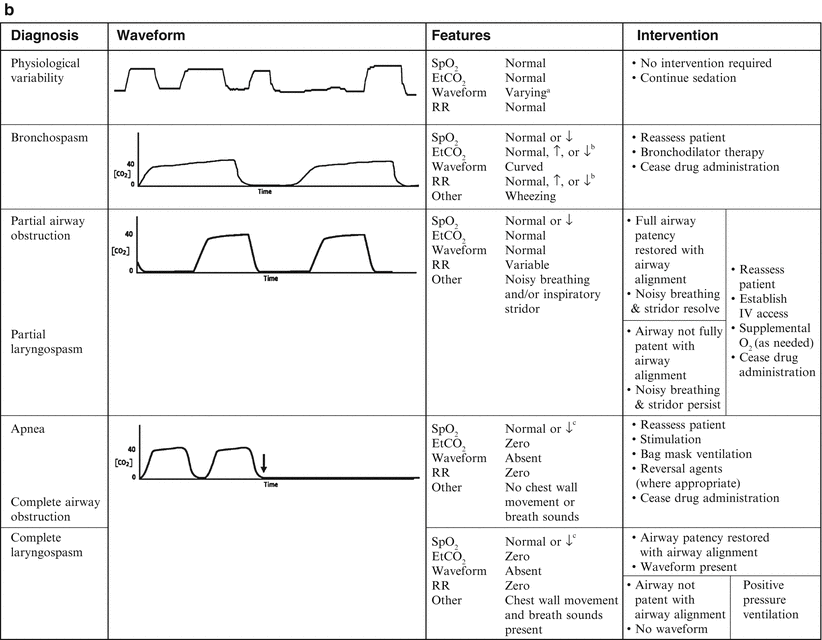
(a, b) Capnographic airway assessment for procedural sedation and analgesia. Source: Krauss and Hess [24]. aVarying waveform amplitude and width. bDepending on duration and severity of bronchospasm. cDepending on duration of episode
The shape of the waveform is affected by the EtCO2 and the expiratory time. The amplitude of the waveform is determined by the EtCO2 value and the width is determined by the expiratory time. Hyperventilation (increased respiratory rate, decreased EtCO2) results in a low-amplitude and narrow waveform, while classical hypoventilation (decreased respiratory rate, increased EtCO2) results in a high-amplitude and wide waveform (Fig. 6.3). Acute bronchospasm results in a waveform with a curved ascending phase and upsloping alveolar plateau (Fig. 6.3). An EtCO2 > 70 mmHg, in patients without chronic hypoventilation, indicates respiratory failure.
Capnography provides a continuous, breath-by-breath measure of respiratory rate and CO2 exchange and can detect the common adverse airway and respiratory events associated with procedural sedation and analgesia [24]. Capnography is the earliest indicator of airway or respiratory compromise and will manifest an abnormally high or low EtCO2 well before pulse oximetry detects a falling oxyhemoglobin saturation, especially in patients receiving supplemental oxygen. Early detection of respiratory compromise is especially important in infants and toddlers who have smaller functional residual capacity and greater oxygen consumption relative to older children and adults. Capnography provides a non-impedance respiratory rate directly from the airway (via oral–nasal cannula) that is more accurate than impedance-based respiratory monitoring. In patients with obstructive apnea, impedance-based monitoring will interpret chest wall movement without ventilation as a valid breath.
Both central and obstructive apnea can be rapidly detected by capnography (Fig. 6.3). Loss of the waveform, in conjunction with no chest wall movement and no breath sounds confirms the diagnosis of central apnea. Obstructive apnea is characterized by loss of the waveform, chest wall movement, and absent breath sounds. The absence of the waveform in association with the presence or absence of chest wall movement distinguishes apnea from upper airway obstruction and laryngospasm. Response to airway alignment maneuvers can further distinguish upper airway obstruction from laryngospasm.
There are two types of drug-induced hypoventilation that occur during procedural sedation and analgesia (Fig. 6.3) [24]. Bradypneic hypoventilation, commonly seen with opioids, is characterized by an increased EtCO2 and an increased PaCO2. Respiratory rate is depressed proportionally greater than tidal volume resulting in bradypnea, an increase in expiratory time, and a rise in EtCO2, graphically represented by a high-amplitude and wide waveform (Fig. 6.3). Bradypneic hypoventilation follows a predictable course with EtCO2 increasing progressively until respiratory failure and apnea occur. Although there is no absolute threshold at which apnea occurs, patients without chronic hypoventilation with EtCO2 > 70 mmHg are at significant risk.
Hypopneic hypoventilation, commonly seen with sedative–hypnotic drugs, is characterized by a normal or decreased EtCO2 and an increased PaCO2 as airway dead space remains constant and tidal volume is decreasing (Fig. 6.3). Tidal volume is depressed proportionally greater than respiratory rate, resulting in low tidal volume breathing that leads to an increase in airway dead space fraction (dead space volume/tidal volume). As tidal volume decreases, airway dead space fraction increases which in turn results in an increase in the PaCO2–EtCO2 gradient. Even though PaCO2 is increasing, EtCO2 may remain normal or may be decreasing, graphically represented by a low-amplitude waveform (Fig. 6.3). Hypopneic hypoventilation follows a variable course and may remain stable with low tidal volume breathing resolving over time as CNS drug levels decrease and redistribution to the periphery occurs, progress to periodic breathing with intermittent apneic pauses (which may resolve spontaneously or progress to central apnea), or progress directly to central apnea.
Stay updated, free articles. Join our Telegram channel

Full access? Get Clinical Tree


