Pharmacology and Therapeutics in Gynecologic Cancer
DAVID S. ALBERTS  HILARY CALVERT
  MARIA LLURIA-PREVATT
  PAUL SUGARBAKER
 BRADLEY J. MONK
The determinants of effective cancer drug therapies include drug disposition, tumor kinetics, and drug resistance. These factors profoundly influence the cytotoxicity of each anticancer drug and must be considered in designing therapeutic regimens. These principles are discussed in Chapter 15. In this chapter, we elaborate on the basic and clinical pharmacology of cancer chemotherapeutic and biologic agents and provide a limited discussion of cytotoxic, molecularly targeted antiangiogenesis and modulating/supportive care drugs useful in the treatment of patients with gynecologic cancer.
DETERMINANTS OF EFFECTIVE DRUG THERAPIES
Drug Disposition Factors
The term pharmacokinetics describes the time course of drug disposition in body fluids and tissues through the use of mathematical models. These models use an equation or set of equations to describe the concentration-versus-time profile of a specific drug after administration into the body. The models are often illustrated by box diagrams, with each box or compartment corresponding to a region of the body, although the compartments may not represent real anatomic regions. A drug is considered to be uniformly distributed within a compartment if its concentration within tissues has reached homogeneity.
Pharmacokinetic models may be useful in predicting the plasma or tissue concentrations of drugs in the body after any one of several routes or methods of drug administration. The simplest model has one compartment into which the drug is assumed to be instantaneously introduced, and elimination occurs by one linear route. The disappearance of the drug from this compartment can be described by a straight line if plotted on semilogarithmic graph paper. As discussed by Tozer (1), no one-compartment pharmacokinetic model can be used to describe the disposition of commonly used anticancer drugs; nevertheless, the one-compartment pharmacokinetic model lends itself to an understanding of the concept of plasma half-life (i.e., t½), which represents the time required for the concentration of a drug at any point on the plasma concentration · time elimination curve to achieve half its value. This constant may be applied repeatedly, so that, for instance, only 25% of the drug remains in 2 half-lives. The equation for plasma half-life that can be applied to any linear plasma concentration-time elimination curve is as follows: t½z = 0.693/slope of the linear elimination curve (i.e., λz or rate constant for that part of the curve). Unfortunately, the determination of the terminal half-life of a drug is often poorly reproducible because it is highly dependent on measuring multiple plasma levels, often at the limit of drug assay sensitivity.
Pharmacokinetic Models
The pharmacokinetics of virtually all anticancer drugs requires 2- or 3-compartment models for their mathematic description. These models are commonly referred to as biphasic or triphasic models (i.e., 2 or 3 phases observed on semilogarithmic plots). Conceptually, the one-compartment model relates to a drug that remains confined to the intravascular space after intravenous injection, and the 2- or 3-compartment model allows the pharmacokinetic description of anticancer drugs whose ultimate targets are beyond the intravascular space in tumor tissues.
Drug Clearance and AUC Concepts
Wisdom dictates using the simplest mathematical model that can provide the “best” fit of the actual plasma concentration time data using nonlinear least squares regression. After the mathematic model is selected, it is possible to generate the important pharmacokinetic parameters that describe the disposition of a specific anticancer drug within the body. Besides the determination of the terminal-phase plasma half-life (i.e., half-life related to the second or third phase of biphasic or triphasic plasma concentration time data), the area under the plasma disappearance curve (AUC0∞) and total body plasma clearance (ClT) are the most significant and clinically useful pharmacokinetic parameters. The relationship between AUC and clearance is simplified to: dose = clearance × area.
Although the height of an anticancer drug’s peak plasma level (Cmax) generally correlates with peak dose and the degree of toxicity, the drug’s plasma AUC tends to correlate better with its ultimate antitumor activity and normal tissue side effects. For example, when identical doses of melphalan are administered first orally and then intravenously at a 1-month interval, because of its poor oral availability, the melphalan plasma AUC after the oral dose would be only one-third of that after the intravenous dose (Fig. 14.1). As would be anticipated, the equivalent intravenous dose of melphalan was associated with a twofold to threefold deeper nadir in granulocytes and a greater than twofold increase in objective response rates in various cancer types (e.g., myeloma).
The plasma AUC (in mg/mL · hour) can be estimated through the use of a pharmacokinetic model or measured directly by plotting the drug’s plasma concentrations against time on semilogarithmic graph paper. Then, it is possible to calculate the areas of successive trapezoids under the concentration vs. time curve wherein the upper surface of the trapezoid is a line that connects 2 successive plasma concentration data points. By convention, when the plasma AUC is measured in this way, the terminal part of the AUC is calculated using a triangular area, rather than a trapezoid.
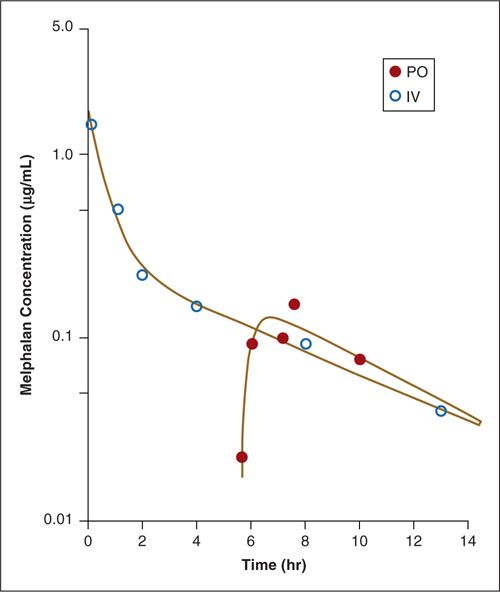
FIGURE 14.1. Plasma disappearance curves for intravenous and oral (tablets) melphalan (0.6 mg/kg) in a patient with ovarian cancer. The melphalan plasma AUC associated with the bolus oral dose was only one-third of that associated with the intravenous dose.
Source: Reprinted with permission from Alberts DS, Chang SY, Chen HS, et al. Oral melphalan kinetics. Clin Pharmacol Ther. 1979;26:737–745.
After the plasma AUC has been determined, it is possible to derive the anticancer drug’s total body clearance rate based on the following formula: ClT = dose (mg)/AUC (mg/mL · hour). The resulting ClT is measured in units of milliliters or liters per minutes or hours, sometimes with normalization to the body surface area. The total body clearance of an anticancer drug depends on the drug’s dose and plasma AUC and represents the rate at which the drug is eliminated from the entire body. The drug’s total body clearance is made up of the combination of renal clearance (ClR) plus nonrenal clearance (ClNR). The renal clearance of a drug can be calculated by the following equation: ClR = Aec/AUC, where Aec is the total amount of the unchanged drug that is excreted in the urine. For many drugs that are glomerularly filtered but not reabsorbed, renal clearance is proportional to creatinine clearance. In a patient with severe renal impairment, if nonrenal clearance is unaltered, the total body clearance of the drug is diminished significantly. This phenomenon is observed in patients with relatively severe renal impairment who receive drugs like methotrexate and carboplatin, both of which are eliminated mainly through renal excretion.
Volume of Distribution
The volume of distribution (Vd) of an anticancer drug is another important pharmacokinetic parameter that relates the drug plasma concentration (measured at the time of administration through extrapolation of the terminal phase of the concentration-time curve to 0 time) to the total amount of drug in the body. Thus, Vdarea represents the volume of distribution of a drug in the terminal phase of its elimination from the body, and in its simplest form, Vd = amount of drug in the body ÷ plasma concentration. Since drug levels are typically measured only in the plasma compartment and not in tissues, most reported Vd values represent the “apparent” Vd of the drug in the plasma. Thus, these Vd values represent a theoretic plasma volume that would account for the drug’s plasma levels after administration. The volume of distribution in the terminal phase can be derived using the following equation: Vdarea = dose/AUC slope (λz), where λz is the rate constant in the terminal phase of a biphasic or triphasic elimination curve.
Linear and Nonlinear Kinetics
Most drugs exhibit linear pharmacokinetics, which in its simplest configuration means that the Cmax and AUC are proportionate to the dose, and the T½ Vd and clearance are constant; that is, they do not change with the dose. Linearity helps make predictions about the effects of changes in doses since the AUC (and the biological effects) of the drug should change in proportion to the dose. Drugs with nonlinear pharmacokinetics such as aspirin, ethanol, and phenytoin, have saturable elimination patterns. This means that small dose changes can disproportionately increase the AUC and the drug’s biologic effects. Drugs with nonlinear pharmacokinetic patterns may therefore have longer T½s and much lower clearance values when the dose is increased.
As discussed by Collins and Dedrick (2), there are at least 2 explanations for nonlinear kinetics. First, nonlinearity may be caused by changes in drug excretion at high doses. For example, at extremely high doses of methotrexate (i.e., 7 to 8 g/m2), the drug load outstrips renal tubular secretion capacity. Second, nonlinearity may be observed for drugs that depend almost completely on elimination through a specific degradative enzyme system (e.g., antimetabolites). Drugs like cytarabine and 5-fluorouracil administered in high doses may overcome the capacity of their respective degradative enzymes with a resultant decrease in their total body clearance rates and an increase in plasma levels that are more than proportionate to their doses.
Intraperitoneal Drug Pharmacokinetics
Intraperitoneal drug administration has become an increasingly important therapeutic strategy in the management of patients with advanced ovarian cancer who have minimal residual intraperitoneal disease after primary or secondary exploratory laparotomies. Three large phase III trials in the Gynecologic Oncology Group (GOG) and the Southwest Oncology Group (GOG-104/SWOG-8501, GOG-114, and GOG-172) comparing various cisplatin-based combination chemotherapeutic regimens administered intravenously (IV) or intraperitoneally (IP) have documented significant survival advantages for the IP cisplatin treatment arms (3–5
Stay updated, free articles. Join our Telegram channel

Full access? Get Clinical Tree


