Bavister’s model for regulation of intracellular pH via amino acid shuttling across the cell membrane.
The pHe that is considered to be “optimal” for in vitro culture of gametes and embryos is based upon numerous variables and factors: not only comparison of in vivo vs. in vitro environment, but also pHi and its effect upon essential biochemical functions of the cells. The pH of human body fluids has an approximate range of pH 7.2 to 7.5, and the pH of oviductal and intrauterine fluids may vary at different stages of the menstrual cycle and at different locations from proximal to distal sections of the Fallopian tube (Fisch et al., 1990). Some of these differences are species dependent, as shown in Table 5.4. This is the basis for the slight variation in pH of some commercially available stage-specific sequential culture media, with early stage media having a slightly higher pH. However, oocyte sibling studies comparing sequential vs. single-stage media between Day 1 and Day 5 have shown that the overall clinical and embryological parameters did not differ significantly with the use of either single-stage or sequential media (Çiray et al., 2012).
| Species | Site | pHe | Reference |
|---|---|---|---|
| Cow | Oviduct | 7.60 | Hugentobler et al. (2004) |
| 6.4–6.7 | Olds & VanDemark (1957) | ||
| Uterus | 6.96 | Hugentobler et al. (2004) | |
| Monkey | Oviduct, follicular phase | 7.2 | Maas et al. (1977) |
| Oviduct, ovulation | 7.6 | ||
| Rabbit | Oviduct | 7.8–8.2 | Hamner & Williams (1965) |
| 7.9 | Vishwakarma (1962) | ||
| Estrous | 7.8 | Iritani et al. (1971) | |
| Pseudo-pregnant | 7.4 | ||
| Isthmus | ~7.24 | Beier (1974) | |
| Infundibulum | ~7.67 | ||
| Uterus | 7.9 | Iritani et al. (1969) | |
| ~7.4–7.8 | Beier (1974) | ||
| 7.8 | Vishwakarma (1962) | ||
| Sheep | Oviduct | 7.4 | Iritani et al. (1969) |
| 6.8–7.0 | Hadek (1953) | ||
| Uterus | 7.0 | Iritani et al. (1969) | |
| Human | Follicle | 7.27 | Shalgi et al. (1972) |
| 7.34 | Fraser et al. (1973) | ||
| 7.26 | Imoedemhe et al. (1993) | ||
| Uterus | 6.5–6.7 | Sedlis et al. (1967) | |
| 7.12 | Yedwab et al. (1976) |
Suppliers of commercial media generally recommend a pHe range of 7.2 – 7.4 for embryo culture (Quinn & Cooke, 2004). However, bearing in mind that the pH scale is logarithmic, a 0.2 variation in pHe represents a 60% change in H+ concentration! Thus, it is important to keep the pHe range as narrow as possible in order to reduce variability in the culture system. As described below, medium pH is affected by the overall stability of the culture system, and factors such as temperature, humidity, altitude, incubator gas concentration, and phase, as well as correct handling, will affect the pHe range; a working knowledge of how pH is determined, regulated, and measured is an essential foundation for troubleshooting an IVF culture system (Box 5.1).
The concept of pH scale was first described in 1909, at the Carlsberg Laboratory in Copenhagen. Whilst studying the effect of ion concentrations on proteins, the Danish biochemist Søren Peder Lauritz Sørensen realized that the concentration of hydrogen ions was of crucial importance, and introduced a scale as an indirect measure of acidity, represented by the negative logarithm of hydrogen ion concentration: pH = −log [H+].
“The magnitude of the hydrogen ion concentration will accordingly be represented by means of the normality factor with regard to the hydrogen ion, and this factor will be written in the form of a negative potenz (power) of 10…I employ the name “hydrogen ion exponent” and the symbol pH for the numerical value of this potenz (power)…” (S. Sørensen (1909). Enzymstudien II: Uber die Messung und die Bedeutung der Wasserstoffenenkonzentation bei enzymatischen Prozessen. Biochem Zeit, 21, 131–200)
Physico-chemical regulation of pH
pH measures the molar concentration of hydrogen ions [H+] in a solution, given by the formula pH = −log [H+].
Adding hydrogen ions to a solution causes it to become more acidic (lower pH), and their removal makes it more alkaline or basic (higher pH). The pH in bicarbonate buffered systems is determined by the Henderson–Hasselbalch (H–H) equation. pH is related to an equilibrium between gas phase CO2 and CO2/HCO3 dissolved in the medium, with carbonic acid as an intermediate:
where,
log10[H+] = log of the reciprocal of the molar concentration of H+ ions
Ka = the acid dissociation constant of a solution, i.e. the point where equal portions of acid and base exist in solutions and equilibrium is reached
pKa =−log10Ka, the ionisation constant for the acid
For a bicarbonate buffered system
In practical terms, the H–H equation for a bicarbonate-buffered medium is
The resulting actual pH is therefore affected by:
The presence of other solutes such as amino acids and complex salt mixtures, since pKa is a function of salt concentration.
Temperature: a good pH meter should have a probe that compensates for temperature. Increasing temperature enhances solubility and ion dissociation, liberating protons (H+) and thus decreasing pH. Temperature increase also has a de-gassing effect, so that CO2 in bicarbonate-buffered culture media is released, increasing pH. The effect of temperature differs at different ranges of pH, as illustrated in Table 5.5.
| Temperature °C | pH 4.00 ± 0.01* | pH 7.00 ± 0.01* | pH 10.00 ± 0.01* |
|---|---|---|---|
| 10 | 4.00 | 7.07 | 10.18 |
| 15 | 4.00 | 7.04 | 10.14 |
| 20 | 4.00 | 7.02 | 10.06 |
| 25 | 4.00 | 7.00 | 10.00 |
| 30 | 4.01 | 6.99 | 9.95 |
| 35 | 4.02 | 6.98 | 9.91 |
| 40 | 4.03 | 6.97 | 9.85 |
| 50 | 4.05 | 6.96 | 9.78 |
| 60 | 4.08 | 6.96 | 9.75 |
(*) = values at 25 °C.
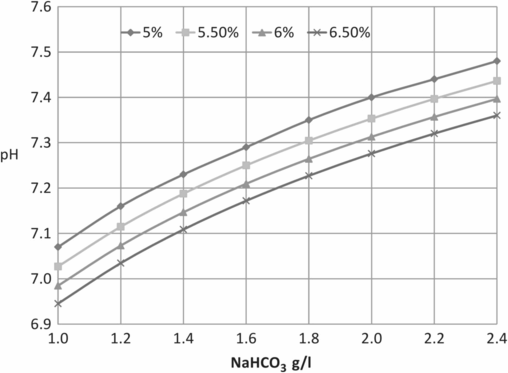
Table 5.6 illustrates the range of variation in pH according to NaHCO3 and CO2 concentrations; exchange between gaseous and dissolved CO2 means that the buffer equilibrium in the aqueous phase is dependent upon CO2 concentration in the gas phase, according to the equation:
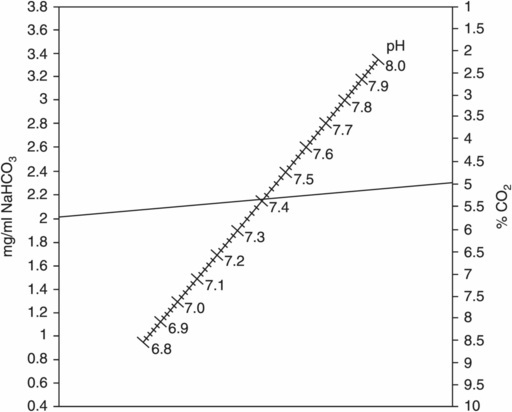
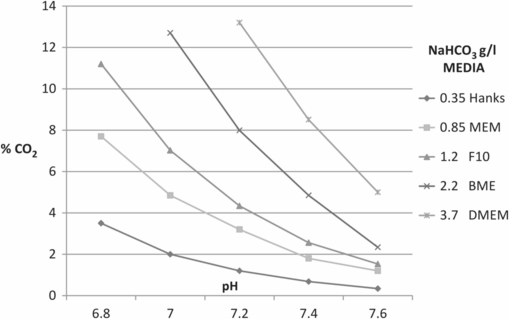
Figures 5.2 and 5.3 illustrate examples of nomograms that can be used to estimate corresponding NaHCO3, CO2, and pH values; Figure 5.4 demonstrates the influence of CO2 concentration on pH in media that contain different concentrations of NaHCO3.
| g/L NaHCO3 | 5% CO2 | 5.5% CO2 | 6% CO2 | 6.5% CO2 |
|---|---|---|---|---|
| 1 | 7.07 | 7.03 | 6.98 | 6.95 |
| 1.2 | 7.16 | 7.11 | 7.07 | 7.03 |
| 1.4 | 7.23 | 7.19 | 7.15 | 7.11 |
| 1.6 | 7.29 | 7.25 | 7.21 | 7.17 |
| 1.8 | 7.35 | 7.30 | 7.26 | 7.23 |
| 2 | 7.4 | 7.35 | 7.31 | 7.28 |
| 2.2 | 7.44 | 7.40 | 7.36 | 7.32 |
| 2.4 | 7.48 | 7.44 | 7.40 | 7.36 |

Nomogram for estimating a pH value at different CO2 and NaHCO3 concentrations.

Nomogram for estimating % CO2 at different pH values, according to bicarbonate concentration.

pH variation in different culture media according to CO2 concentration.
Theoretically, the pH in bicarbonate-buffered systems is also dependent upon the partial CO2 pressure, which is influenced by altitude. Media pH is determined by the amount of CO2 present in the incubator atmosphere, and increasing the % CO2 may be considered if the laboratory is in a mountain region (Table 5.7). However, the practical calculations below demonstrate that the real effect is minimal: an elevation of 2000 m will result in an increase of 0.13 pH units.

An IVF laboratory at 3000 feet above sea level can maintain pH 7.2 using 6% CO2, whilst a laboratory at around 10 000 feet above sea level may require a higher level for similar pH; the incubator display shows the correct % CO2, but lower partial pressure means that this percentage represents fewer CO2 molecules in the atmosphere (Conaghan, 2014). However, other environmental factors such as humidity also need to be considered. If a thermal conductivity (TC) sensor is used to monitor CO2 levels (see Chapter 8), incubator humidity may need to be increased if the external environment is very dry (extra pans of sterile water) to ensure that the sensors are functioning correctly. By contrast, humidity of the air within the laboratory may need to be reduced if the external environment is very humid; this is also important in reducing the risk of fungal infection (see Chapter 9).
Stay updated, free articles. Join our Telegram channel

Full access? Get Clinical Tree


