Fig. 8.1
Pressure–volume curves of the (a) infant and (b) adult respiratory systems. The rest volume is the volume at zero intrathoracic pressure, where the outward recoil of the chest wall is equal to the inward elastic recoil of the lungs. (a) In the neonate, this volume is very low (10–15 % of total lung capacity) compared to the adult, and is just above the FRC and often below the closing volume of the small airways. (b) In the adult, this value is much higher at 30–35 % of the total lung capacity. During sedation, where quiet breathing or respiratory depression may occur, the neonate and small infant are much more prone to airway closure, resulting in intrapulmonary shunting and hypoxemia (Adapted from Agostoni E, Mead J: Statics of the respiratory system. In Fenn WO, Rahn H. (eds): Handbook of Physiology. Section 3: Respiration, vol 1. Washington, DC: American Physiological Society, 1964. 387–409)
Table 8.1
Age-dependent respiratory variables
Variable | Units | Neonate | 6 months | 12 months | 3 years | 5 years | 9 years | 12 years | Adult |
|---|---|---|---|---|---|---|---|---|---|
Approx. weight | kg | 3 | 7 | 10 | 15 | 19 | 30 | 50 | 70 |
Respiratory rate | Breaths/min | 50 ± 10 | 30 ± 5 | 24 ± 6 | 24 ± 6 | 23 ± 5 | 20 ± 5 | 18 ± 5 | 12 ± 3 |
Tidal volume | mL | 21 | 45 | 78 | 112 | 170 | 230 | 480 | 575 |
mL/kg | 6–8 | 6–8 | 6–8 | 6–8 | 7–8 | 7–8 | 7–8 | 6–7 | |
Minute ventilation | mL/min | 1,050 | 1,350 | 1,780 | 2,460 | 4,000 | 6,200 | 6,400 | |
mL/kg/min | 350 | 193 | 178 | 164 | 210 | 124 | 91 | ||
Alveolar ventilation | mL/min | 665 | 1,245 | 1760 | 1,800 | 3,000 | 3,100 | ||
mL/kg/min | 222 | 125 | 117 | 95 | 60 | 44 | |||
Dead space/tidal volume ratio | 0.3 | 0.3 | 0.3 | 0.3 | 0.3 | 0.3 | 0.3 | 0.3 | |
Oxygen consumption | mL/kg/min | 6–8 | 3–4 | ||||||
Vital capacity | mL | 120 | 870 | 1,160 | 3,100 | 4,000 | |||
mL/kg | 40 | 58 | 61 | 62 | 57 | ||||
Functional residual capacity | mL | 80 | 490 | 680 | 1,970 | 3,000 | |||
mL/kg | 27 | 33 | 36 | 39 | 43 | ||||
Total lung capacity | mL | 160 | 1,100 | 1,500 | 4,000 | 6,000 | |||
mL/kg | 53 | 73 | 79 | 80 | 86 | ||||
Closing volume as a % of vital capacity | % | 20 | 8 | 4 | |||||
No. of alveoli | Saccules × 106 | 30 | 112 | 129 | 257 | 280 | 300 | ||
Specific compliance | CL/FRC:mL/cm H2O/L | 0.04 | 0.038 | 0.06 | 0.05 | ||||
Specific conductance of small airways | Ml/s/cm H2O/g | 0.02 | 3.1 | 1.7 | 1.2 | 8.2 | 13.4 | ||
Hematocrit | % | 55 ± 7 | 37 ± 3 | 35 ± 2.5 | 40 ± 3 | 40 ± 2 | 40 ± 2 | 42 ± 2 | 43–48 |
Arterial pH | pH units | 7.30–7.40 | 7.35–7.45 | 7.35–7.45 | |||||
PaCO2 | mmHg | 30–35 | 30–40 | 30–40 | |||||
PaO2 | mmHg | 60–90 | 80–100 | 80–100 |
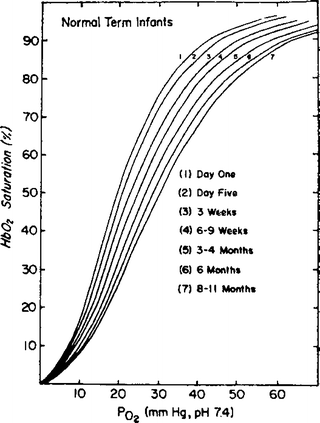
Fetal hemoglobin predominates in the neonate and young infant, and this causes another important difference in respiratory physiology from the older child and adult. The oxyhemoglobin dissociation curve is shifted to the left in neonates because of fetal hemoglobin, meaning that the partial pressure of oxygen necessary to produce an oxyhemoglobin saturation of 50 % (the P50) is only 19 mmHg, versus 27 mmHg with mature adult hemoglobin A [6] (Fig. 8.2). This is an adaptation to fetal life, where oxygen tensions are low, and with hemoglobin F loading the hemoglobin with oxygen molecules is facilitated; however, unloading of oxygen to the tissues is more difficult with a left-shifted curve. Therefore in the neonate and young infant, a given oxygen tension will produce a higher oxygen saturation, but this extra reserve is required to provide additional oxygen to unload to the tissues. Adult hemoglobin A predominates by 6 months of age.


Fig. 8.2
Comparison of oxyhemoglobin dissociation curves from blood of infants at different ages. At birth the P50 is 19 mmHg, and by 8 months of age has shifted to the right and is 27 mmHg, a result of the change from predominately fetal hemoglobin F to adult hemoglobin A (Reproduced with permission from Delivoria-Papadopoulos M, Ronceric NP, Oski FA. Postnatal changes in oxygen transport of term, premature and sick infants: the role of red cell 2,3 diphosphoglycerate and adult hemoglobin. Pediatr Res. 1971;5(6):235–40.)
Pulse oximetry is the standard for monitoring of oxygenation during all sedation procedures. (Refer to Chaps. 2 and 6.) Pulse oximeter arterial saturation (SpO2) is a very useful monitor, generally accurate to ±2 % when compared to arterial blood oxygen saturation measured by co-oximetry. In a child without cardiac or pulmonary disease, normal SpO2 is 96–100 % on room air and unsedated. Sedative medications often cause a degree of hypoventilation, both in slowing respiratory rate, and decreasing tidal volumes and FRC. Upper airway obstruction is also common, which may interfere with oxygenation. These factors make it necessary to deliver supplemental oxygen to virtually all patients undergoing sedation procedures, either by nasal cannula or face mask, to enable SpO2 to remain in the normal 96–100 % range. A decrease of 5 % or less from baseline, as long as the patient is otherwise stable without significant respiratory depression or upper airway obstruction, is common and can usually be treated with increased supplemental oxygen. A decrease of 10 % or more from baseline is cause for urgent intervention to detect and treat upper airway obstruction or hypoventilation—the two most common causes of arterial desaturation during sedation. Children with cyanotic congenital heart disease may have resting awake SpO2 ranging from 70 to 95 %, and it is important to understand the anatomy, pathophysiology, and normal baseline saturations before proceeding with sedation in these patients. The general guidelines of a 5 % decrease from baseline being common and treated with additional supplemental oxygen, and a 10 % decrease, a cause for urgent intervention, are applicable to this population as well. Other patients with chronic lung diseases—i.e., bronchopulmonary dysplasia (BPD) or cystic fibrosis—may also have decreased baseline SpO2, often ranging from 85 to 95 %.
Monitoring of respiration also often includes end-tidal CO2, which can easily be monitored using a special or modified nasal cannula. Although dilution of the exhaled gas with inspired oxygen, poor fit of nasal cannula, increased dead space ventilation, or right to left intracardiac shunting often increases the gap between arterial blood PaCO2 and end-tidal CO2, it is a very sensitive monitor of airway obstruction, and an accurate method to measure respiratory rate. In addition, low cardiac output states or cardiac arrest is accompanied by a sudden decrease or absence of end-tidal CO2.
Common conditions in pediatric patients that reduce respiratory reserve even further include BPD in former premature infants who suffered from respiratory distress syndrome (RDS) [7]. BPD is defined as a chronic condition of fibrosis and loss of alveoli in the lung following RDS with a requirement for supplemental oxygen beyond 30 days of life. These infants may present for sedation months or years later, and even though they have apparently recovered, pulmonary reserve is often considerably limited. Other common chronic conditions include asthma or reactive airway disease, affecting an estimated six million children in the USA [8]. Pre-sedation assessment must always include questioning about asthma and a thorough airway and pulmonary examination; elective sedation in the face of an asthma exacerbation is contraindicated.
Children also have frequent upper respiratory infections (URIs), which predispose them to increased airway complications during a sedation procedure. Elective sedation procedures should be performed in children with URIs only after a thorough risk–benefit assessment.
All of the factors reviewed earlier make the small infant in particular vulnerable to rapid onset of hypoxemia and hypercarbia if sedated too deeply, and the practitioner must be vigilant especially when sedating infants. Supplemental oxygen should be used in almost every setting in which infants and children are sedated, the only exceptions being in premature neonates where retinopathy of prematurity may be a risk, and in relatively uncommon congenital heart defects in neonates with a single functional ventricle, such as hypoplastic left heart syndrome.
Cardiovascular Physiology
Development from Neonate to Older Infant and Child
At birth the neonatal heart must suddenly change from a parallel circulation to a series circulation, and the left ventricle in particular must adapt immediately to dramatically increased preload from blood returning from the lungs, and increased afterload as the placental circulation is removed. The very high oxygen consumption of the newborn necessitates a high cardiac output for the first few months of life. However, animal models have demonstrated that the fetal and newborn myocardium develops less tension in response to increasing preload (sarcomere length), and that cardiac output increases less to the same degree of volume loading [9, 10]. Resting tension, however, is greater in the newborn compared to the mature heart. This information suggests that the newborn heart is operating near the top of its Frank–Starling curve, and that there is less reserve in response to both increased afterload and preload. The newborn myocardium also has only a limited ability to increase its inotropic state in response to exogenous catecholamines, and is much more dependent on heart rate to maintain cardiac output than the mature heart. One reason for this is the high levels of circulating endogenous catecholamines that appear after birth, necessary to make the transition to extrauterine life [11]. As these levels decrease in the weeks after birth, contractile reserve increases.
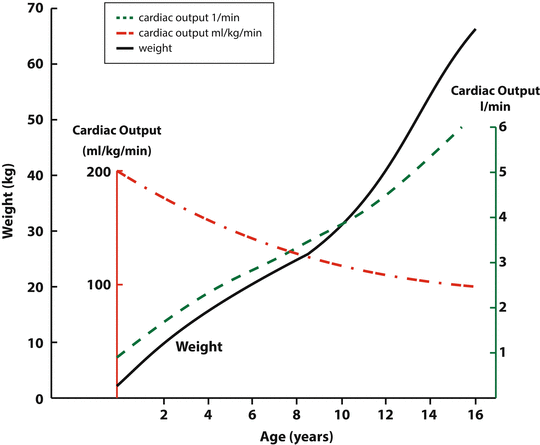
The neonatal myocardium is less compliant than the mature myocardium, with increased resting tension as noted previously, and a significant greater increase in ventricular pressure with volume loading [12]. This implies that diastolic function of the neonatal heart is also impaired compared to the mature heart [13]. The myofibrils of the newborn heart also appear to have a greater sensitivity to calcium, developing a greater tension than adult myofibrils when exposed to the same free Ca++ concentration in vitro [14]. Table 8.2 summarizes the major physiological differences between the neonatal and mature hearts [15]. With increased metabolic needs, including oxygen consumption and glucose for metabolic substrate, cardiac output indexed to weight in the neonate is double that of the adult [16] (Fig. 8.3).
Table 8.2
Summary of major differences between neonatal and mature hearts
Neonatal | Mature | |
|---|---|---|
Physiology | ||
Contractility | Limited | Normal |
Heart rate dependence | High | Low |
Contractile reserve | Low | High |
Afterload tolerance | Low | Higher |
Preload tolerance | Limited | Better |
Ventricular interdependence | Significant | Less |
Ca ++ cycling | ||
Predominant site of Ca++ flux | Sarcolemma | Sarcoplasmic reticulum |
Dependence on normal iCa++ | High | Lower |
Circulating catecholamines | High | Lower |
Adrenergic receptors | Downregulated, insensitive | Normal |
β2, α1 predominant | β1 predominant Complete | |
Innervation | Parasympathetic predominates; sympathetic incomplete | Complete |
Cytoskeleton | High collagen and water content | Lower collagen/H2O |
Cellular elements | Incomplete SR, disorganized myofibrils | Mature SR, organized myofibrils |


