Nutrition, Food Security, and Health

Chapter 43 Nutrition, Food Security, and Health


Malnutrition as the Intersection of Food Security and Health Security


Undernutrition is usually an outcome of 3 factors: household level food security, access to health and sanitation services, and child caring practices. A mother with few economic resources who knows how to care for her children and is enabled to do so can often use available food and health services to produce well-nourished children. If food resources and health services are available in a community, but the mother does not access immunizations or does not know how or when to properly add complementary foods to her child’s diet, that child might become malnourished (Table 43-1).


Table 43-1 THREE MYTHS ABOUT NUTRITION


From World Bank: Repositioning nutrition as central to development, 2006 (PDF). http://web.worldbank.org/WBSITE/EXTERNAL/TOPICS/EXTHEALTHNUTRITIONANDPOPULATION/EXTNUTRITION/0,contentMDK:20787550~menuPK:282580~pagePK:64020865~piPK:149114~theSitePK:282575,00.html. Accessed May 23, 2010.


Undernutrition is not simply a result of food insecurity, although food security is often a necessary but insufficient condition for nutrition security. Many children in food-secure environments and from better-off families are underweight or stunted because of inappropriate infant feeding and child care practices, poor access to health services, or poor sanitation. In many countries where malnutrition is widespread, food production or even access to food might not be the most limiting factor. The most important causes of undernutrition are often inadequate knowledge about the benefits of exclusive breast-feeding and complementary feeding practices, the role of micronutrients, and the lack of time women have available for appropriate infant care practices and their own care during pregnancy. The situation is different in famine and emergency settings, where food insecurity is often among the most important factors.


Economic growth and food production as well as birth spacing and women’s education are also important but less-direct routes to improving nutrition outcomes in developing countries. Shorter routes to nutrition improvements often come through the provision of health, sanitation, and nutrition education and counseling services, including the promotion of exclusive breast-feeding and appropriate and timely complementary feeding, coupled with prenatal care and basic maternal and child health services. In many contexts, micronutrient supplementation and fortification are also key elements of a public health strategy aimed at addressing undernutrition.


Food Insecurity


Governments seek to promote the food security of their population both for its intrinsic value and for its instrumental value as well. The former refers to the fact that individuals value food security in its own right, whereas the latter acknowledges the contribution that food security makes toward improved nutrition. But what is food security? One prevalent definition of food security views it as access by all people at all times to sufficient food in terms of quality, quantity, and diversity for an active and healthy life without risk of loss of such access. To achieve food security, it is necessary to look at 3 dimensions of food security: availability, access, and utilization. Availability refers to the supply of food (generally grain in the market, reflecting economic conditions of production and trade), whereas access is at the household level, reflecting purchasing power as well as transfer programs. Access also has an intrahousehold dimension, because food is not necessarily shared equitably within a household. The utilization pillar reflects the fact that even when a household has access to food, it does not necessarily achieve nutritional security.


Measurement of Food Insecurity


The most commonly used measurement of food insecurity is the Food and Agriculture Organization’s (FAO’s) measure of undernourishment, expressed in terms of the number of persons who are assumed to be unable to meet daily calorie requirements necessary for light activities. In the period 2003-2005, the FAO estimated that 848 million individuals were hungry or undernourished, and 97% of these individuals were in developing countries, an increase of 20 million undernourished individuals in developing countries compared to 1995-1997.


This estimate of undernourished individuals is based on country-level annual food balance sheets that take into account food production plus net imports minus net trade. This gross availability is also adjusted for seeds used for replanting as well as grain fed to animals and an allowance for waste. The estimates also acknowledge that the average national food availability is not uniformly distributed, and they thus make adjustments for an assumed inequality of access based on historical patterns.


This estimate is, therefore, not based on direct measurement of household or individual consumption. However, it has the advantage of being available on an annual basis for virtually all countries. Therefore, it assists in monitoring global trends. Reductions in the number of undernourished individuals as calculated using this indicator of food access have been used as a measure of progress in reducing poverty, albeit other indicators (percent underweight or stunted children) are better indicators for tracking changes at household and national levels.


The undernourishment measure being based on national food balance sheets cannot be disaggregated by regions or by income or other household characteristics and is therefore not a very useful measure, especially at household or individual levels. There are often differences with estimated levels of hunger using this indirect approach and levels derived based on surveys of consumption or expenditure recorded at the household level. Such surveys are commonly undertaken in most countries, often with samples that are representative at regional or subregional levels and that permit analysis of correlates of food insecurity. The surveys often are collected over rounds, and they thus allow an understanding of seasonal food insecurity. Consumption may be based on recall or on a diary of expenditures and home consumption. There is no consensus on the relative advantages of diary approaches compared with interviews given the level of education in food-insecure regions of the world, and there is not full agreement on the period of recall that provides the greatest accuracy of reporting. Nevertheless, with the widespread availability and range of data contained in these surveys, they provide the basis for substantial analysis on the determinants of household food insecurity.


Individual food insecurity is better understood using 24-hr food recall data. Such methods, preferably repeated over a period of days within a week, allow a measure of individual intake and of intrahousehold variation of food consumption. Although these data are harder to collect and less available, they are a better source of information on diet diversity than household or national indicators. Diet diversity is a strong predictor of child growth and a valuable tool for understanding micronutrient intakes, a dimension of nutritional security that is generally not emphasized in data on food security based on food balance sheets.


Undernutrition


The greatest risk of undernutrition occurs during pregnancy and in the first 2 years of life (Fig. 43-1); the effects of this early damage on health, brain development, intelligence, educability, and productivity are potentially irreversible (Table 43-2). Governments with limited resources are therefore best advised to focus publicly funded actions on this critical window of opportunity, between preconception and 24 mo of age. Folate deficiency also increases the risk of birth defects; this particular window of opportunity is before conception, as it is with iodine. Iron deficiency anemia is another dimension of undernutrition that has measurable risks that extend outside of the early years of life, with particular risks to the health of a mother as well as for the birth weight of her child. Anemia can also reduce physical and cognitive function and economic productivity of adults of both sexes.
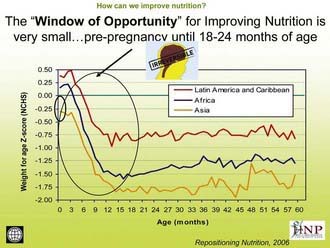


Table 43-2 WHY MALNUTRITION PERSISTS IN MANY FOOD-SECURE HOUSEHOLDS


From World Bank: Repositioning nutrition as central to development, 2006 (PDF). http://web.worldbank.org/WBSITE/EXTERNAL/TOPICS/EXTHEALTHNUTRITIONANDPOPULATION/EXTNUTRITION/0,contentMDK:20787550~menuPK:282580~pagePK:64020865~piPK:149114~theSitePK:282575,00.html. Accessed May 23, 2010.


Measurement of Undernutrition


The term malnutrition encompasses both ends of the nutrition spectrum, from undernutrition (underweight, stunting, wasting, and micronutrient deficiencies) to overweight. Many poor nutritional outcomes begin in utero and are manifest as low birthweight (LBW). Prematurity and intrauterine growth restriction (IUGR) are the two main causes of LBW, with prematurity relatively more important in developed countries and IUGR relatively more important in developing countries (Chapter 90).


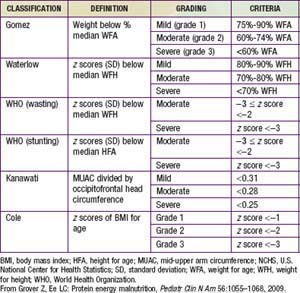
In preschool- and school-aged children, nutritional status is often assessed in terms of anthropometry. International references have been established that allow normalization of anthropometric measures in terms of z scores defined as the child’s height (weight) minus the median height (weight) for the age and sex of the child divided by the relevant standard deviation (Table 43-3). The World Health Organization (WHO) recently revised the child growth references based on data from healthy children in 5 countries. Comparisons of malnutrition rates across countries are meaningful, and these growth references are applicable to all children across the globe.


Height for age is useful for assessing the nutritional status of populations, because this measure of skeletal growth reflects the cumulative impact of events affecting nutritional status that result in stunting and is also referred to as chronic malnutrition. This measure contrasts with weight for height, or wasting, which is a measure of acute malnutrition. Weight for age is an additional commonly used measurement of nutritional status. Although it has less clinical significance because it combines stature with current health conditions, it has the advantage of being somewhat easier to measure: Current weighing scales allow a child to be weighed in a caregiver’s arms, but weight for height requires 2 different instruments for measurement. Height for age is particularly difficult to measure for the most vulnerable children <2 yr of age for whom recumbent length is the preferred indicator for height. In emergencies and in some field settings, mid-upper arm circumference (MUAC) is often used for screening in lieu of weight for height (see Table 43-3).


Obesity as well as energy deficiency among adults is often reported in terms of the Body Mass Index (BMI). BMI is calculated by dividing weight in kilograms by the square of height in meters. Individuals are considered to be chronically energy deficient if they have a BMI below 18.5, overweight if they have a BMI greater than 25, and obese if they have a BMI greater than 30.


Another dimension of malnutrition is micronutrient deficiencies. The micronutrients of particular public-health significance are iodine, vitamin A, iron, folic acid, and zinc. Iodine deficiency and its sequelae (goiter, hypothyroidism, and developmental disabilities including severe mental retardation) are assessed by clinical inspection of enlarged thyroids (goiter) or by iodine concentrations in urine (µg/L). Even mild forms of iodine deficiency during pregnancy have been implicated in poor mental and physical development among children as well as fetal losses. The public-health benchmark for eliminating iodine deficiency in a population is <20% of the population with urinary iodine levels <50 µg/L (Chapter 51).


Vitamin A deficiency is caused by low intake of retinol or its precursor, beta-carotene. Absorption can be inhibited by a lack of fats in the diet or by parasite infestations. Clinical deficiency is estimated by combining night blindness and eye changes—principally Bitot spots and total xerophthalmia prevalence. Subclinical deficiency is assessed as prevalence of serum retinal concentrations <0.70 µmol/L (Chapter 45). The greatest public-health significance of vitamin A deficiency is its association with a higher mortality among young children. Prophylactic supplementation of vitamin A among deficient populations for children <5 yr of age can reduce child mortality by as much as 23%.

Children commonly suffer from anemia, either as a result of low iron intakes or poor absorption or as a result of illness or parasite infestation, although severe protein-energy malnutrition and vitamin B12 or folate deficiency can also lead to anemia. Women also have relatively high rates of anemia as a result of low iron intakes, poor absorption, illness, or excessive losses of blood. Severe protein-energy malnutrition and vitamin B12 or folate deficiency can also lead to anemia. Anemia is most commonly measured as grams of hemoglobin per liter of blood. Cutoffs to define anemia are 11 g/dL for children 6-59 mo, 11.5 g/dL for children 5-11 yr, and 12 g/dL for children 12-14 yr. Cutoffs to define anemia are 12 g/dL for nonpregnant women, 11 g/dL for pregnant women, and 13 g/dL for men.


Zinc supplementation can reduce child mortality, especially when combined with oral rehydration therapy for diarrheal disease. Plasma concentrations respond in a dose-dependent manner to dietary changes, and urinary excretion correlates with zinc status overall, but there is not yet a biomarker standard that is widely used as a cutoff to define a public health concern.


Prevalence of Undernutrition


Maternal and child undernutrition is prevalent in many developing countries and in some middle-income countries. It is estimated that about 16% of children across developing countries are born with low birthweight (LBW). LBW rates are highest in the south-central Asia region (27%) and lowest in South America. In 2005, 20% of children <5 years of age in low- and middle-income countries were underweight (weight-for-age <−2 standard deviations [SD]), and 32% were stunted (height-for-age <−2 SD). Somewhat surprisingly, underweight rates in many south Asian countries (India, Bangladesh, Nepal, and Pakistan) are much higher than, and often nearly double, the rates in many sub-Saharan African countries. The combination of the high prevalence rates and the large population sizes in Asia mean that this region carries the highest burden of underweight children. Even though underweight and stunting are more prevalent among the poor, the prevalence rates among the highest income quintiles are also high, thereby reiterating the fact that undernutrition is not just a result of food insecurity.


About 42% of pregnant women and 47% of children <5 yr of age in developing countries are anemic. Zinc deficiency is harder to measure and is assessed on the basis of indirect indicators such as stunting; it is estimated to be high in south Asia, sub-Saharan Africa, and some countries in Central and South America. Vitamin A deficiency rates have improved significantly in most developing countries, primarily owing to high coverage with high-dose vitamin A supplements given twice a year to every child <5 yr of age as part of public-health programs. Nevertheless, 100-140 million people are considered deficient in vitamin A, with deficient populations found in Brazil and Andean South America as well as much of sub-Saharan Africa and South Asia. Large-scale availability of iodized salt has reduced the rates of iodine deficiency; nonetheless, approximately 1 billion people do not have regular access to iodized salt, including in large areas of Africa and the former Soviet Union.


Consequences of Undernutrition


The most immediate consequence of undernutrition is premature death. The global estimates conclude that stunting, severe wasting, and IUGR jointly contributes to 2.2 million deaths of children <5 yr of age. This accounts for 35% of all child mortality globally, even though this estimate is lower than those previously reported. The earlier and widely cited estimate had suggested that undernutrition was associated with nearly 53% of all child deaths. The risk of death increases even with mild undernutrition, and as the severity of undernutrition increases, the risk increases exponentially; the probability of mortality for a child <5 yr of age with a z score of weight for age below −3 is nearly 4 times the elevated risk for a child with a z score between −3 and −2. Because there are more children with less-severe malnutrition, it is this category that contributes the greater share of the global burden of malnutrition. After controlling for the occurrence of multiple nutritional deficits, deficiencies of vitamin A and zinc are estimated to be responsible for an additional 0.6 million and 0.4 million child deaths, respectively. More than 3.5 million mothers and children under 5 years die every year due to undernutrition-related causes, and many millions more are disabled or stunted for life. By the time children reach their first birthday, if undernourished, they could suffer irreversible physical and cognitive damage, thereby impacting their future health, welfare, and economic well being. These consequences continue into adulthood, and the cycle of undernutrition is passed on to the next generation when undernourished women give birth to low birth weight babies.

Stay updated, free articles. Join our Telegram channel

Jun 18, 2016 | Posted by in PEDIATRICS | Comments Off on Nutrition, Food Security, and Health

Full access? Get Clinical Tree

Get Clinical Tree app for offline access