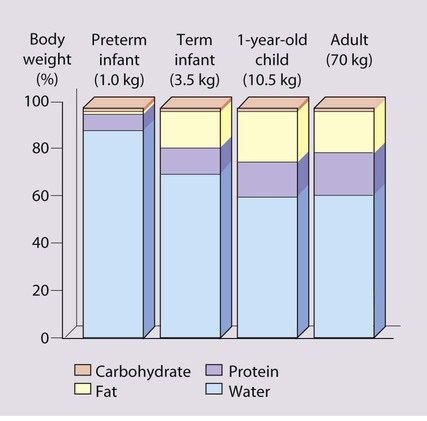
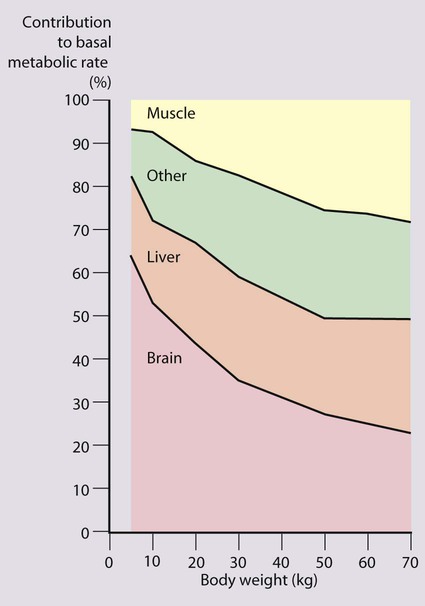
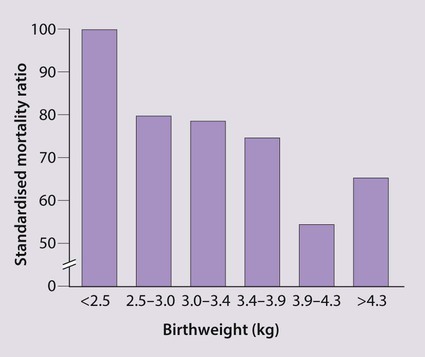
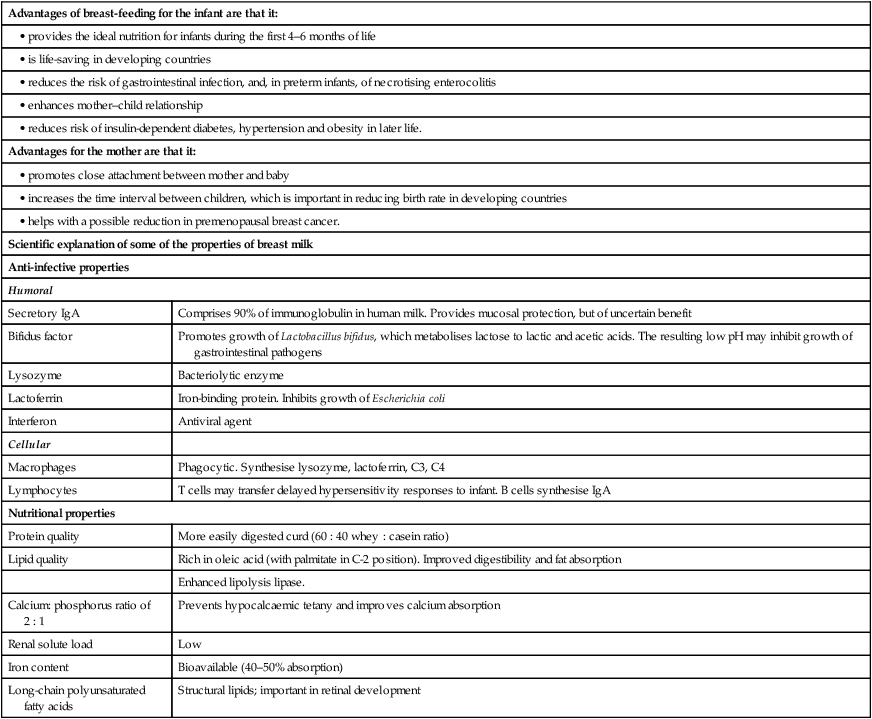
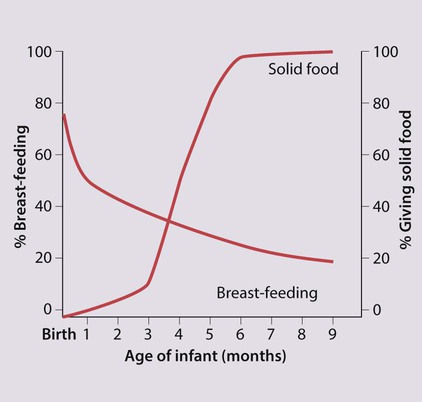
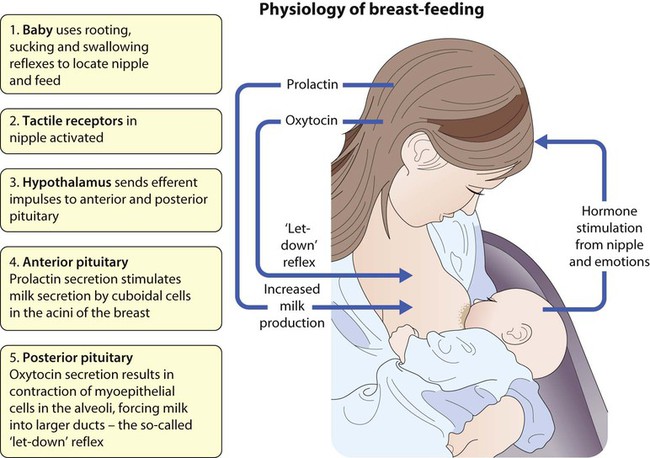
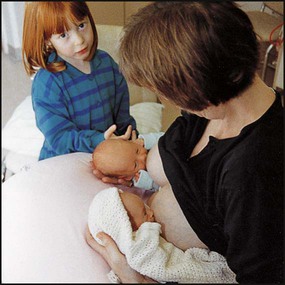
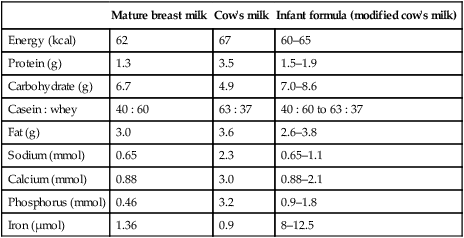
Notable features of nutrition in children are: • The optimal nutrition for newborn infants is from breast-feeding. • Inadequate nutrition in infants and young children rapidly leads to weight loss followed by growth failure, commonly called failure to thrive, which if severe and prolonged leads to malnutrition • Whereas malnutrition is a major cause of morbidity and death in developing countries, obesity is the major nutritional problem in developed countries. The nourishment children require, per unit body size, is greatest in infancy (Table 12.1), because of their rapid growth during this period. At 4 months of age, 30% of an infant’s energy intake is used for growth, but by 1 year of age, this falls to 5%, and by 3 years to 2%. The risk of growth failure from restricted energy intake is therefore greater in the first 6 months of life than in later childhood. Even small but recurrent deficits in early childhood will lead to a cumulative deficit in weight and height. Table 12.1 Reference values for energy and protein requirements The brain grows rapidly during the last trimester of pregnancy and throughout the first 2 years of life. The complexity of interneuronal connections also increases substantially during this time. This process appears to be sensitive to undernutrition. Even modest energy deprivation during periods of rapid brain growth and differentiation is thought to lead to an increased risk of adverse neurodevelopmental outcome. This is not surprising when one considers that at birth the brain accounts for approximately two-thirds of basal metabolic rate, and at 1 year for about 50% (Fig. 12.2). Many studies have drawn attention to the delayed development seen in children suffering from protein-energy malnutrition due to inadequate food intake, although inadequate psychosocial stimulation may also contribute. Evidence suggests that undernutrition in utero resulting in growth restriction is associated with an increased incidence of coronary heart disease, stroke, non-insulin-dependent diabetes and hypertension in later life (Fig. 12.3). There is also a similar but weaker association with low weight at 1 year of age. The mechanism is unclear, but it is recognised that fetal undernutrition leads to redistribution of blood flow and changes in fetal hormones, such as insulin-like growth factors and cortisol. Alternatively, it may be the rapid, postnatal growth (catch-up) seen in babies suffering from intrauterine growth restriction that is the causal factor. As one cannot readily tell how much milk a baby is taking from the breast, the baby’s weight should be checked regularly, every few days in the first couple of weeks, then weekly until feeding is well established. Successful breast-feeding of twins can be achieved, but is more difficult (Fig. 12.4). It is rarely possible to totally breast-feed triplets and higher-order births. Preterm infants can be breast-fed, but the milk will need to be expressed from the breast until the infant can suck. Maintaining the supply of milk can be a problem for mothers of preterm babies. While two-thirds of mothers in the UK initially breast-feed, this proportion rapidly declines during the first few months (Fig. 12.5). Nearly 90% of social class I mothers start breast-feeding, but only 60% of mothers from social class V. Breast-feeding is restrictive for the mother, as others cannot take charge of her baby for any length of time. This is particularly important if she goes to work and may delay her return, which may cause financial hardship for the family. Facilities for breast-feeding in public places remain limited. Failure to establish breast-feeding will sometimes cause significant emotional upset in the mother. Infants who are not breast-fed require a formulafeed based on cow’s milk. Unmodified cow’s milk is unsuitable for feeding in infancy as it contains too much protein and electrolytes and inadequate iron and vitamins. Even after considerable modification, differences remain between formula feeds and breastmilk (Table 12.2) Table 12.2 A comparison of human milk, cow’s milk and infant formula (per 100 ml)
Nutrition
The nutritional vulnerability of infants and children
High nutritional demands for growth
Age
Energy (kcal/kg per 24 h)
Protein (g/kg per 24 h)
0–6 months
115
2.2
6–12 months
95
2.0
1–3 years
95
1.8
4–6 years
90
1.5
7–10 years
75
1.2
Adolescence
(male/female)
11–14 years
65/55
1.0
15–18 years
60/40
0.8
Rapid neuronal development
Long-term outcome of early nutritional deficiency
Linear growth of populations
Disease in adult life
Infant feeding
Breast-feeding
Potential complications (Box 12.2)
Formula-feeding
Mature breast milk
Cow’s milk
Infant formula (modified cow’s milk)
Energy (kcal)
62
67
60–65
Protein (g)
1.3
3.5
1.5–1.9
Carbohydrate (g)
6.7
4.9
7.0–8.6
Casein : whey
40 : 60
63 : 37
40 : 60 to 63 : 37
Fat (g)
3.0
3.6
2.6–3.8
Sodium (mmol)
0.65
2.3
0.65–1.1
Calcium (mmol)
0.88
3.0
0.88–2.1
Phosphorus (mmol)
0.46
3.2
0.9–1.8
Iron (µmol)
1.36
0.9
8–12.5
![]()
Stay updated, free articles. Join our Telegram channel

Full access? Get Clinical Tree


Obgyn Key
Fastest Obstetric, Gynecology and Pediatric Insight Engine

