Axial T1-weighted in-phase (a) and out-of-phase (b) images demonstrate a 2 cm incidental right adrenal nodule. It is intermediate in signal on the in-phase image (arrows) and becomes dark on the out-of-phase image (arrows). This signal loss is indicative of microscopic fat within the lesion and effectively diagnostic of an adrenal adenoma.
Out-of-phase images contain an interesting artifact (Figure 18.1b). Dark lines are present at the interface of tissues composed of mainly fat and those composed of mainly water. This phenomenon results from the fact that voxels at these interfaces contain both fat and water, and the signal from these two types of proton cancel each other out, resulting in a low signal voxel. When one looks at opposed phase images the organs appear as if they have been etched with ink and hence, this artifact is referred to as “etching” artifact or “India ink” artifact. Not only is the artifact useful in identifying the out-of-phase set of images, but it also highlights fatty content of a structure that is contained within a mainly water-containing structure.
An extension of CSI is the so called “Dixon method.” In this technique, a further step is taken with the in- and out-of-phase image to obtain water-only and fat-only images. If the two sets of images are added, then the fat signal in the in-phase images (water + fat) is cancelled by the subtracted fat signal in the out-of-phase images (water – fat) to give water-only images [(water + fat) – (water – fat) = (water + water)]. If the out-of-phase images are subtracted from the in-phase images then fat-only images are generated [(water + fat) – (water – fat) = (fat + fat)]. This intuitively simple technique turns out to be clinically powerful, especially when modified to overcome some inherent shortcomings of the original method [3,4].
Chemical shift selective suppression of fat
The chemical shift between water and fat is used to perform macroscopic fat suppression imaging in CHESS. Macroscopic fat is bulk fat as in adipose cells. This technique is also referred to as fat saturation, or in short “fat sat.” In this technique, the macroscopic fat signal is suppressed by first selectively exciting fat with a narrow bandwidth radiofrequency excitation pulse and then nulling these excited fat protons with a “spoiler gradient.” Immediately, the imaging sequence is started before the lipid signal can recover. Fat saturation imaging helps to increase image contrast and highlight lesions, such as contrast-enhancing tissue, edema, and blood products by eliminating the bright signal from fat so that the full spectrum of display contrast can be applied to a narrower spectrum of image contrast. Fat saturation is useful for detecting larger quantities of fat (Figure 18.2). The technique, however, is susceptible to magnetic field inhomogeneities such as those caused by foreign bodies, tissue interfaces, etc. This can result in poor fat suppression and may even result in areas of water suppression.
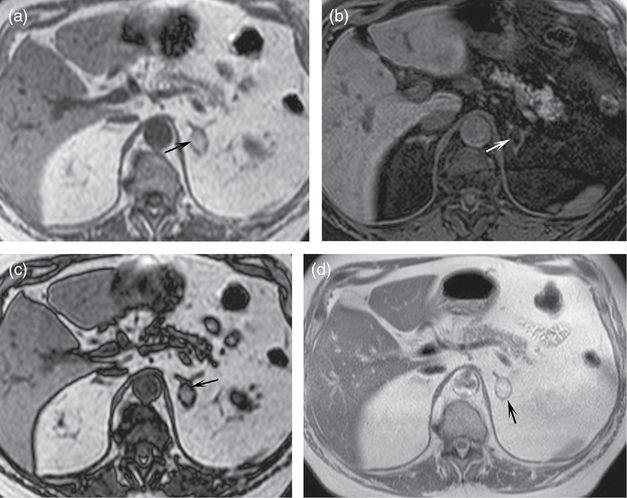
Axial T1-weighted in-phase (a), T1-weighted fat saturated (b), out-of-phase (c), and T2-weighted (d) images demonstrate a mass in the left adrenal gland. Note that it is relatively bright on the T1-weighted in-phase image (a, arrow) and becomes dark on the T1-weighted fat saturated image (b, arrow). The signal change follows that of fat in the retroperitoneum and subcutaneous spaces. A macroscopic fat-containing lesion within the adrenal gland is effectively diagnostic of a myelolipoma. Notice on the out-of-phase image (c, arrow) that there is a dark line at the interface of the mass and the normal adrenal gland. Dark lines are also present outlining many of the organs which are in a sea of fat. This is an artifact called “etching” or “India ink” and is found on out-of-phase images. It occurs at interfaces of predominantly fat-containing and predominantly water-containing structures. It can serve as a sign that a lesion contains fat, as in this case. Also note that the T2-weighted non-fat saturated image (d) nicely defines the adrenal lesion (arrow) as well as the other abdominal structures. Non-fat saturated T2-weighted images are optimal for defining the anatomy as they have high signal to noise ratio.
CHESS is commonly utilized in T1-weighted post-contrast images. The frequency selective technique only suppresses fat signals and not the shortened T1 signals due to intravenous contrast, as might be the case with a suppression technique based on tissue T1, such as inversion recovery (IR), which is discussed below. CHESS can be added to virtually any pulse sequence at the expense of slightly increased scan time. Another disadvantage of the fat sat technique is that it is not useful when there is only a small amount of fat within a given voxel. The decrease in signal due to microscopic quantities of fat may be undetectable. Recall, however, that detection of microscopic fat is the strength of in- and out-of-phase imaging. Thus, the two techniques are complementary.
Inversion recovery fat suppression
Another widely utilized method of fat suppression is based on the IR principle. This type of technique nulls the signal from a specific tissue type based on the intrinsic MR decay property of a tissue called T1. The T1 of fat is different (shorter) than that of water. IR sequences, such as short-tau inversion recovery (STIR), take advantage of this difference to suppress the fat signal. This is accomplished by an MRI pulse sequence that first completely inverts the tissue magnetization. As the magnetization is recovering, the imaging excitation pulse is started after a specific “inversion time” (TI) chosen such that the recovering magnetization of fat protons is exactly crossing the null point. Thus, there is no signal from the lipid protons, but there is signal from other tissue with different T1 values.
The IR technique is useful for obtaining homogeneous tissue suppression, because it is insensitive to magnetic field heterogeneity. However, this method is not tissue specific and has the potential to suppress non-desired tissue types. For example, when suppressing fat, non-fat tissue with similar T1 values, such as blood products or gadolinium-enhanced tissues, may also be suppressed. Therefore, T1-weighted STIR imaging is primarily used to highlight fluid, rather than detect fat.
T2-weighted images
As mentioned, MR images can highlight various tissue properties. T2 is an MR tissue property that relates to the way spinning protons interact with each other (spin-spin relaxation). It turns out that free water has long T2 times, while other soft tissue and fat have relatively shorter T2 times. Since pathology is often associated with inflammation and edema, pathologic tissue tends to have high signal on T2-weighted images (with definite exceptions, including prostate cancer, which has lower T2 signal than surrounding normal prostatic peripheral zone.) MR sequences are termed T2 “weighted” because the images are weighted towards a specific property, such as T2, but retain components of other properties, such as T1 or proton density.
T2-weighted images can be obtained without or with fat suppression. Fat-suppressed T2-weighted images highlight fluid/edema and thus, pathology (Figure 18.3a and b). Non-fat-saturated T2-weighted images are very useful for demonstrating the anatomy, as they tend to have high signal to noise and high contrast to noise (Figure 18.2d).
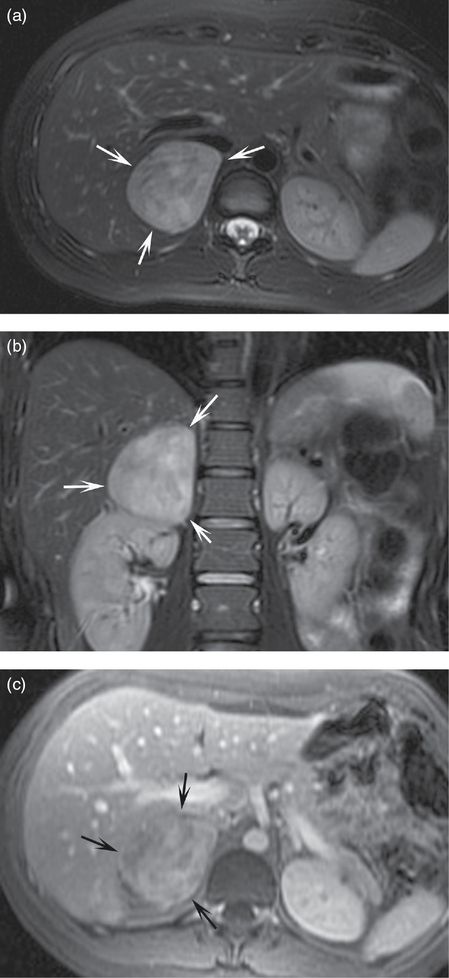
A large mass in the right suprarenal space demonstrates bright signal on T2 fat-saturated axial (a) and coronal (b) images. The mass is heterogeneously hyperenhancing on T1-weighted fat-saturated post-contrast image (c). This mass was resected and was demonstrated to be a pheochromocytoma on pathology. Note that the T2 fat-saturated images highlight the pathology and this bright T2 signal is classic for, but not specific or sensitive for, pheochromocytoma.
T1-weighted images
T1-weighted images do not have the tissue contrast of T2-weighted images. However, they are well suited for the detection of fat (both with CSI and CHESS as above). T1-weighted images require relatively little MR scanner time when gradient recalled technique is used. Finally, and most importantly, T1-weighted fat-saturated images are the sequences in which contrast enhancement is assessed.
Post-contrast images
MR intravenous contrast agents are for the most part gadolinium-based. Gadolinium is an element that shortens the T1 time of the water protons that form complexes with it. This property increases the signal from these protons on T1-weighted images. Gadolinium by itself is toxic. Thus, MR contrast agents are actually the gadolinium atom surrounded by certain chelating compounds. These formulations can be given intravenously. The agents then circulate in the blood and reach all tissues in a matter of seconds. Many of the gadolinium-based agents can freely enter the interstitium and equilibrate between the blood pool and the interstitium until the agent is excreted from the body. Timing of the post-contrast imaging, especially during the first minute after contrast injection, will determine where the majority of the contrast is and, thus, what is highlighted. Arterial phase post-contrast images obtained at approximately 20 seconds post-injection highlight the major arteries. Venous phase images obtained approximately 70 seconds after injection demonstrate organ perfusion as well as venous structures. Delayed images obtained, for example, at 3 minutes or later display how the contrast has washed out from certain areas of pathology. Multiple phases can be imaged during a study after a single contrast injection to obtain a wealth of information on vascular anatomy and organ and pathology perfusion characteristics.
MRI appearance of normal adrenal glands
The limbs of the normal adrenal glands give them characteristic shapes on cross-sectional imaging. It is this shape and the location in the suprarenal region that identify the adrenal glands on MRI. On both axial and coronal images the adrenal glands take on an inverted “V” or inverted “Y” configuration (Figure 18.4). The adrenal cortex and medulla cannot be differentiated on conventional MRI, and the glands appear homogeneous in signal.
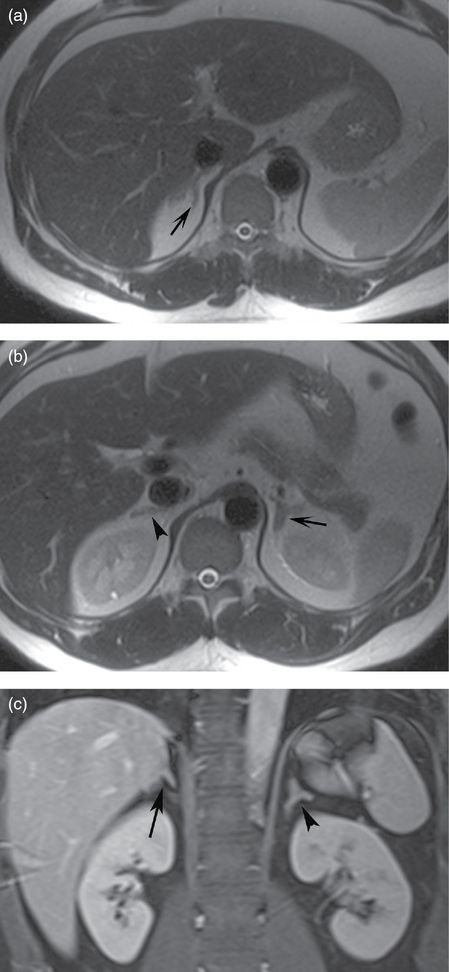
Axial T2-weighted (a, b) images and coronal T1-weighted fat saturated post-contrast image (c) demonstrate normal right and left adrenal glands. Note the inverted “Y” configuration on both coronal and axial planes and the expected location in the suprarenal space. The limbs of the glands are thin and elongated. The right adrenal gland is usually located at a level slightly above the left adrenal gland.
The right adrenal gland is located slightly superior to the left adrenal gland. It is above the right kidney, lateral to the right crus of the diaphragm, medial to the liver, and posterior to the inferior vena cava. The left adrenal gland is above the left kidney, lateral to the left crus of the diaphragm, and posterior to the pancreas.
The normal adrenal glands can sometimes be difficult to identify, especially if there is a paucity of surrounding retroperitoneal fat. One aid is to look for dark structures in the expected locations on out-of-phase images. Because normal adrenal tissue contains a sufficient amount of intracytoplasmic lipids, which are precursors for hormone production [5], there is signal loss on the out-of-phase images and the glands appear dark.
Adrenal adenoma
The most common use of adrenal MRI is in the diagnosis of adrenal adenomas. This may be in the setting of a patient with clinical and/or biochemical evidence of hormonal excess, in the setting of an incidentally detected adrenal nodule on imaging obtained for some other reason, or in the setting of an adrenal nodule detected on a metastatic survey in a patient with known malignancy.
The power of MRI is its ability to diagnose an adenoma without ionizing radiation or intravenous contrast. This ability stems from the fact that a large proportion of adrenal adenomas contain a significant amount of intracytoplasmic lipid, whereas metastatic lesions generally do not [6]. Rare exceptions of microscopic fat-containing metastatic lesions to the adrenal gland from renal cell and hepatocellular carcinoma have been reported [7].
Microscopic intracytoplasmic fat in an adenoma is detected as signal loss on the out-of-phase images relative to the in-phase images. While the signal loss is often visually evident (Figure 18.1), it can be quantified by drawing regions of interest (ROI) within the adrenal nodule on both the in-phase and out-of-phase images to calculate the average signal intensity in each sequence. Signal loss of 15–20% on the out-of-phase image is diagnostic of an adenoma [8,9].
The degree of intracytoplasmic fat does not differentiate between hyperfunctioning and non-hyperfunctioning adenomas. However, atrophy of the remaining adrenal gland and the contralateral gland does suggest hyperfunction with feedback ACTH suppression [10].
In a symptomatic patient with hormone excess, a diagnosis of adenoma will provide a target for therapy. In an incidental lesion, the diagnosis is reassuring and may prompt a search for occult hormone excess. In the case of a person with known malignancy, a positive identification of an adenoma may mean the difference between a diagnosis of local organ-confined disease (in the absence of other lesions) versus a diagnosis of distant metastatic disease.
Unfortunately, not all adrenal adenomas contain enough microscopic lipid to cause significant signal loss on the out-of-phase images. In fact, approximately 30% of adenomas are “lipid-poor” [5,11]. Thus, the lack of signal loss on out-of-phase imaging does not completely rule out an adrenal adenoma. In such cases, the next imaging step (if not already obtained) is to perform an adrenal protocol dynamic contrast-enhanced CT. Adenomas tend to enhance early as well as wash out the contrast. This is in contrast to metastatic lesions. Thus, if an adrenal nodule fulfills certain criteria for contrast washout during the dynamic contrast-enhanced CT, a diagnosis of adenoma can be made [12].
Additionally, a non-contrast CT may also detect microscopic lipid in an adenoma. This is done by measuring the attenuation of the lesion. An attenuation of less than 10 Hounsfield Units on the unenhanced CT is generally taken to indicate intracytoplasmic lipid and thus, be diagnostic of an adenoma [12]. This brings up the question of which imaging test to order first when one needs to make the diagnosis of an adrenal adenoma in the three clinical settings outlined above: adrenal protocol MRI or adrenal protocol CT. Given the lack of ionizing radiation and lack of intravenous contrast during the MRI examination, MRI may have the advantage in a setting where it is available and in a patient who can tolerate the MRI, which is a longer exam in a more confined space than CT.
Stay updated, free articles. Join our Telegram channel

Full access? Get Clinical Tree


