Fig. 31.1
The three-compartment pharmacokinetic model enlarged with an effect compartment. (Adapted from [94])
Important Mathematical Concepts for Understanding of Pharmacokinetic Models
Many physiological processes depend on concentration gradients and so display first-order kinetics (Fig. 31.1). For most anesthetic agents, the enzymes involved in metabolism are not saturable at clinical concentrations, and thus the amount of drug metabolized during any unit of time depends on the plasma drug concentration at that time. Similarly, redistribution of most anesthetic drugs is a passive process in which the rate and direction of redistribution depend on the concentration gradient between the blood and other tissues.
For any first-order process, the variable of interest changes in an exponential manner. Depending on the process, the variable may either increase or decrease exponentially. When the variable of interest is an amount (e.g., the mass of drug or the number of millimoles of drug) then the changes in this variable over time can be described mathematically in the following general way (the formula applies equally well to other exponential process such as population growth or the arterial blood pressure changes during diastole):
 where A(0) is the amount at time zero, t is the time since the start of the process, A(t) is the amount at time t, k is the rate constant (with units of the inverse of time—typically min−1), and e is an irrational constant approximately equal to 2.7182. The rate constant k describes the proportional change over a unit of time. If k = 1, then A(t) increases by a multiple of e1 in each unit of time, i.e., A(t) increases by 271.8 % in each unit of time. On the other hand if k = −1, then A(t) changes by a factor of e−1 (=1/e = 0.367) in each unit of time, which means that A(t) decreases by 63.3 % in each unit of time.

The rate of change of A(t) at time t can be calculated mathematically as the first differential of A(t) as follows:
 Thus although the proportional change is constant, the absolute change over a unit of time changes according to the amount, A(t), present during that unit of time.

In pharmacology we are often more interested in concentrations than amounts, and we are commonly dealing with situations where gradients decline over time. For these situations the following general equation will apply:
 where C(0) is the concentration at time zero, t is the time since the start of the process (e.g., the time since drug administration), C(t) is the concentration at time t, and k is the rate constant.

Half-Life, Time Constant, and Rate Constant
The time constant, τ(tau), is another rate descriptor, but with units of time. Mathematically it is the inverse of the rate constant (i.e., 1/k) and represents the time taken for a change by a factor of e (i.e., an increase of 271 % or a decrease of 63 %).
Rate and time constants are not intuitively easy to understand, and thus the pharmacology literature often uses half-lives to describe the time course of exponential processes. Simply put, the half-life describes the time it takes for a change by a factor of 2, i.e., for the amount to change to double or half the initial value. By definition the half-life is shorter than the time constant. Mathematically the half-life can be calculated as follows:


Volume of Distribution
If serial measurements of the concentration of a drug can be performed, then it is possible, with knowledge of the time course of drug administration, and appropriate mathematical techniques, to calculate a volume of distribution (an apparent volume in which the drug has been distributed). Few drugs distribute uniformly throughout the body. Most distribute into different tissues at different rates. In these situations, an “initial volume of distribution” (V1 or Vc) is often described. It can be calculated as follows:
 Since drugs do not mix instantaneously on injection, C(0) is calculated by extrapolating the time–concentration curve back to time zero. If the volume of distribution, Vd, is larger than the circulating blood volume, then the drug is likely to have rapidly mixed in the blood and extracellular fluids.

The volume of distribution at steady state, Vdss, is the apparent volume of distribution once adequate time has been allowed for complete equilibration of the drug across all tissues. In multicompartmental models, Vdss is the mathematical sum of the volumes of all compartments in the model. For drugs with extensive protein binding and/or high lipid solubility, the peripheral tissues will have a large capacity to absorb the drug, resulting in a Vdss greater than the volume of the entire body.
Single Compartment Pharmacokinetic Models
The behavior of a drug that does not undergo redistribution can be described by a single compartment mathematical model. On injection, the drug distributes uniformly throughout a single volume, V, and the drug concentration in this compartment is the same as the plasma concentration. After a single bolus or an infusion, the drug concentration will decline because of metabolism or elimination, as described by the following equation:
 where C p(t) is the plasma concentration at time t, C p(0) is the initial plasma concentration, k el is the elimination rate constant, and t = 0 is the time of the bolus or the time at which the infusion ceased. Clearance (mL/h) can be calculated from k el as follows:
 If the relationship between drug concentration and time is plotted on linear axes then the exponential decline results in a curved graph (Fig. 31.2). If however, a semilogarithmic graph is used (i.e., the logarithm of the concentration is plotted) a straight line will result. Figure 31.3 shows the relationship between loge C p(t) and time.
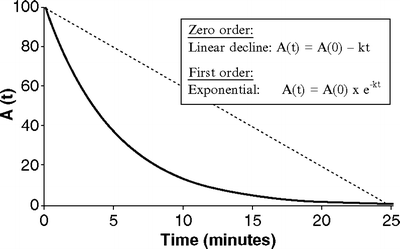
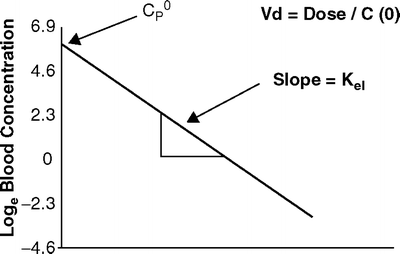


Fig. 31.2
Exponential versus linear decay. The (dotted) straight line represents linear decay, in which the amount of drug at time t is a linear function of the initial amount. The curve (solid) illustrates exponential decay in which the amount of drug at time t is an exponential function of the initial amount

Fig. 31.3
The relationship between log e drug concentration and time after a bolus of a drug with single compartment kinetics. The slope of the elimination curve is constant
As shown the elimination rate constant can be calculated from the slope of the line in Fig. 31.3. If the natural logarithm (loge or “ln”) of the drug concentration is plotted against time, then the slope is simply equal to k el. As there is only one rate constant influencing the rate of decline in drug concentration, the decline in plasma concentrations has a constant t 1/2 that can be calculated from k el as shown previously.
Three Compartment Models
The pharmacokinetics of most anesthetic drugs are best described by three compartment models. Each model describes the number of compartments, and their volumes, the rate of drug metabolism or elimination, and the rate of transfer of drug between the different compartments. The concept is summarized in Fig. 31.1.
By convention, the compartment into which the drug is injected is called the central compartment (V1 or Vc), which may be thought of as including the blood volume, although it can be larger than the blood volume. It is sometimes referred to as the initial volume of distribution. Elimination of active drug by metabolism usually occurs from within this compartment (as in the case of hepatic or renal metabolism). The rate of elimination is described interchangeably by a rate constant (k 10) or a clearance (Clearance = k 10 × V1). The second compartment, V2, is referred to as the “rapid redistribution” compartment since drug concentrations in V2 equilibrate rapidly with those in the central compartment. The rate constants k 12 and k 21 are used to describe the rate of drug transfer from V1 to V2 and from V2 to V1, respectively. Fast redistribution clearance, “Clearance 2,” can be calculated as:
 The third compartment, V3, is often referred to as the “slow” compartment (because there is rather slower drug distribution between V1 and V3). Here the rate constants k13 and k31 are used to describe the rate of drug transfer from V1 to V3 and from V3 to V1, respectively. Slow redistribution clearance, “Clearance 3,” can be calculated as:
 The second and third compartments are sometimes referred to as the “vessel rich” and “vessel poor” compartments, respectively, but these terms are best avoided since they encourage the false impression that these compartments represent distinct anatomical or physiological entities. The sum of V1, V2, and V3 gives the “volume of distribution at steady state,” Vdss.


The site of action of the anesthetic agents is, of course, not in the vascular system, but in the brain at a vaguely defined “effect site.” Thus, many models now also include the effect site as a fourth compartment, with the rate constant k eo being used to describe the rate of equilibration between the central and effect-site compartments.
For a drug showing three compartment kinetics (such as propofol), the change in concentrations after a bolus or infusion cannot be described by a single rate constant or half-life. The decline in plasma concentration is more complex because it is influenced by several simultaneous exponential processes, each with a different rate constant, so that the time required for the concentration to fall by 50 % (or any other proportion) changes over time. Figure 31.4 shows a typical curve of the relationship between blood concentration and time after a single bolus dose of an anesthetic drug. The time course of changes in plasma concentration shown in Fig. 31.4 can be described mathematically as the sum of three exponential processes as follows:
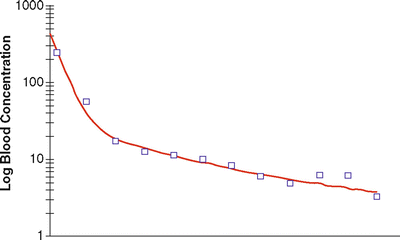
 where A, B, C, α(alpha), β(beta), and γ(gamma) are constants. As can be seen in Fig. 31.4, in the early phase after a bolus dose, the plasma concentration falls rapidly, being mostly influenced by rapid redistribution (described by a rate constant α[alpha]). Later on the rate of decline in plasma concentrations is influenced mostly by redistribution to less well-perfused tissues (described by a rate constant β[1]). Eventually the predominant factor is elimination (rate constant γ[gamma]). From these parameters the time-honored redistribution and elimination half-lives can be calculated.

Fig. 31.4
Relationship between plasma concentration (after a bolus dose) and time for a typical anesthetic agent, displaying tricompartment kinetics. The squares represent typical measured concentrations and the red line represents a curve generated the sum of three exponentials

During and after administration of repeated bolus doses or infusions, the changes in drug concentrations vary in a complex matter since they are influenced by several simultaneous exponential processes, and the relative contributions of the different processes change for most anesthetic drugs as the duration of infusion increases. These factors make it difficult to predict drug concentrations without the assistance of computer programs.
Context-Sensitive Half-Time
The concept of “context-sensitive half-time” (CSHT) has been introduced as a simple metric that provides a summary of the interplay of time and the different half-lives after an infusion [31].
It describes the time taken for blood concentration of a drug to fall by 50 % after the end of an infusion of a specified duration—the context is thus the duration of infusion. The influence of duration of infusion on CSHT indicates the degree of drug accumulation and the balance between redistribution and metabolism/elimination. This metric only describes the time taken for the first decline of 50 %—the time taken for subsequent 50 % falls will be different. Also, it does not necessarily describe when clinical effects will cease, since these depend on the initial concentration, and pharmacodynamic factors such as the sensitivity of the patient to the drug. Nonetheless, it gives the physician a useful indicator of the rate at which drug concentrations will decline after an infusion and an indication of the influence of duration of infusion.
Pharmacokinetic Models for Propofol
During the early 1990s a study of the predictive accuracy of the “Marsh” adult propofol model in 20 children showed that it significantly overestimated the blood concentrations (i.e., measured blood concentrations were less than expected) [32]. This was consistent with other work showing that the pharmacokinetics of propofol differ between children and adults [33, 34].
The Marsh model was then revised to produce a model specific to children (the size of the central compartment volume was increased, but remained a linear function of body weight), and when prospectively tested, the predictive performance was improved compared with the adult model [32].
Since then several other models specific to children have been produced. Schüttler published a complex model in 2000 based on a combined analysis of data from several other studies [35]. This model, which contains multiple covariates, and adjusts for mode of drug administration (bolus versus infusion) and sampling site (arterial versus venous), was designed for use in a wide range of patients including children. The Short model, on the other hand, was designed specifically for the pediatric population [36], but like the Schüttler model it is seldom used in clinical practice.
The Kataria and Paedfusor models (Table 31.1) are the most commonly used models at present and are available in commercially available TCI systems available in most countries of the world (but not the USA). Despite the fact that the models were developed in different ways, and that weight is incorporated in a different way in each model, the overall model parameters are fairly similar. Figure 31.5 shows a comparison of the cumulative propofol dose for children weighing 14 and 20 kg when the Kataria and Paedfusor models are used to administer a target blood concentration of 2.5 μ(mu)g/mL.
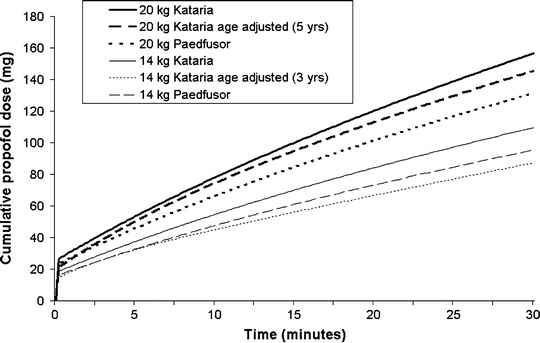
Table 31.1
Kataria and Paedfusor pediatric propofol models
Kataria [37] Weight proportional | Kataria [38] Weight proportional, age adjusted | |||||
|---|---|---|---|---|---|---|
Model | 20 kg patient | Model | 20 kg patient | Model | 5 years, 20 kg patient | |
V1 | 0.458 L/kg | 9.2 L | 0.52 L/kg | 10.4 L | 0.41 L/kg | 8.2 L |
V2 | 1.34 L/kg | 26.8 L | 1.0 L/kg | 20 L | 0.78 L/kg + (3.1 × age)–16 | 15.1 L |
V3 | 8.20 L/kg | 163.9 L | 8.2 L/kg | 164 L | 6.9 L/kg | 138 L |
K10 (min−1) | 70 × Weight−0.3/458.4 | 0.062 | 0.066 | 0.066 | 0.0854 | 0.0854 |
K12 (min−1) | 0.12 | 0.12 | 0.113 | 0.113 | 0.1878 | 0.1878 |
K13 (min−1) | 0.034 | 0.034 | 0.051 | 0.051 | 0.0634 | 0.0634 |
K21 (min−1) | 0.041 | 0.041 | 0.059 | 0.059 | 0.077 × weight/V2 | 0.1020 |
K31 (min−1) | 0.0019 | 0.0019 | 0.0032 | 0.0032 | 0.0038 | 0.0038 |

Fig. 31.5
Cumulative propofol doses administered to children weighing either 12 or 20 kg, by TCI systems programmed with the Kataria or Paedfusor pharmacokinetic models for propofol (target concentration 2.5 μ[mu]g/mL)
Kataria et al. used three different pharmacokinetic modeling techniques in an extended group of children between 3 and 11 years and found that the pharmacokinetics of propofol could be described by a three compartment model [37]. They found that a weight-proportional model performed significantly better than a model with fixed volumes and rate constants. Adjusting V2 (and hence k 12 and k 21) according to age produced a further (modest) improvement. Although Kataria recommended that the weight proportional model be used, some investigators have used the weight proportional model with age adjustment. The equation used to adjust V2 for age is likely to yield an anomalous (negative) V2 for children younger than 3 years, and thus the age-adjusted, weight-proportional model should not be used in children younger than 3 years.
The Paedfusor model [38] was adapted from one of the preliminary models developed by Schüttler prior to the publication of his final model [35] and was incorporated in a pediatric TCI pump developed and used in Glasgow. In the Paedfusor model the central compartment volume and clearance have a nonlinear correlation with weight, whereas in the final Schüttler model all variables have a nonlinear correlation with age and weight.
A recent study investigated the predictive performance of eight existing pediatric propofol models in children between 3 and 26 months of age [39]. Most models performed acceptably, but interestingly the Short model was found to perform best.
With increasing size, pharmacokinetic parameters change in a complex nonlinear way, and the scaling techniques used in the models described earlier do not deal optimally with size-related changes in very young and small children. It is increasingly being recognized that allometric scaling best describes the relationships between clearances and size [40]. Recent work in Groningen, using allometric scaling for size, and a maturation function (to deal with changes in organ and enzyme function in the early months after month), has produced a single pharmacokinetic model for propofol that appears to accurately predict propofol concentrations from 6 months through to old age [41].
Pediatric Propofol Infusion Regimens
Disadvantages of Repeated Bolus Dose Administration
Although it is possible to maintain sedation or anesthesia with repeated boluses of an intravenous sedative agent, this is far from ideal. Firstly, stable levels of sedation are not possible since the blood and effect-site concentrations will be constantly either rising or falling. If the bolus size is too big, the patient state will oscillate from excessive sedation/anesthesia, with the attendant risks, to inadequate sedation. Secondly, it is difficult to judge the dose required to produce adequate, but not excessive blood concentrations. Finally, it is also difficult to judge the required interval between doses. Figure 31.6 shows the estimated blood concentrations arising from repeated 40 mg boluses of propofol administered to a 20 kg child. In these simulations, a bolus was administered each time the estimated concentration fell to 2 μ(mu)g/mL. As can be seen, as drug accumulates in peripheral tissues, the rate of decline in blood concentration after successive doses gradually decreases, resulting in an increase in the interval between doses.
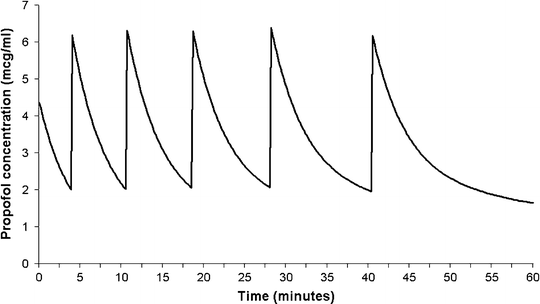

Fig. 31.6
Estimated blood propofol concentrations resulting from repeated 40 mg boluses of propofol in a 20 kg child. In this simulation, a repeat bolus was administered each time the estimated concentration fell to 2 μ(mu)g/mL. Note how the rate of decline in concentration after successive doses gradually decreases; resulting in an increase in the interval between doses
Commonly Used Regimens
Typically, blood concentrations of the order of 2–3 μ(mu)g/mL are required for sedation in children. Naturally the concentration required is influenced by multiple other factors such as co-administered drugs. Thus, it is not surprising that after cardiac surgery, Murray et al. found that the mean measured propofol concentration at recovery of consciousness was only 0.97 μ(mu)g/mL [42], whereas Rigouzzo et al. found that the EC50 (of measured blood propofol concentration at steady state) associated with loss of consciousness in healthy children was 4.0 μg/mL [43].
A commonly used deep sedation regimen for is an initial bolus of 2 mg/kg followed by an infusion at 10 mg/kg/h (in children <1 year of age, higher doses may be required, e.g., an initial bolus of 3 mg/kg and higher initial infusion rates). Figure 31.7 shows a simulation of the regimen, with the concentrations estimated by the Paedfusor model. At about 10 min after the initial bolus the blood concentrations reach a nadir of ~2.5 μ(mu)g/mL. If the infusion rate is kept constant at 10 mg/kg/h, the blood and effect-site concentrations, and clinical effect will gradually increase (reaching ~5 μ[mu]g/mL after several hours), which is why downward titration of the infusion rate is commonly required.
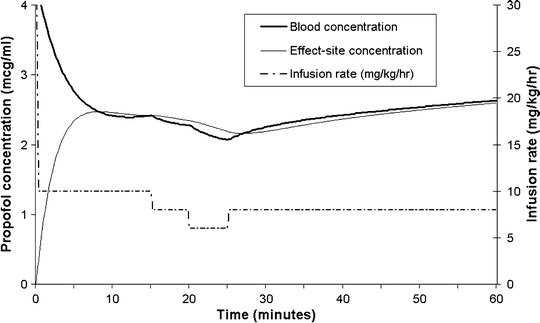

Fig. 31.7
Blood and effect-site concentrations (heavy and light continuous lines, respectively, as estimated by the Paedfusor model with a k eo of 0.91 min−1), arising from an initial bolus of 2 mg/kg, followed by an infusion initially at 10 mg/kg/h. Note the slow blood and effect-site concentration changes after step changes in infusion rate at 15, 20, and 25 min. Also, note that the concentrations continue to rise when the infusion rate is kept constant
In a recent study, Koroglu and colleagues administered a 3 mg/kg bolus followed by infusions of 10–15 μ(mu)g/kg/min (i.e., 6–9 mg/kg/h) of propofol to 30 children between 1 and 7 years of age for sedation during MRI scans [22]. With this propofol regimen, sedation was adequate in 27 of the 30 children, cardiorespiratory stability was reasonable, and mean recovery and discharge times were 18 and 27 min, respectively.
PK Models for Dexmedetomidine
Pharmacokinetic models for dexmedetomidine in children have recently been produced from studies involving single bolus administration [44], after short infusions [45], and after longer infusions [46] for postoperative sedation. Further studies are needed to compare the predictive accuracy of these models to determine which perform optimally in clinically relevant situations.
Infusion Regimens for Dexmedetomidine
Despite the low α(alpha)1 affinity of dexmedetomidine, rapidly administered boluses cause bradycardia and hypertension. Typical infusion regimens thus usually comprise an initial bolus over 10 min, followed by a continuous infusion. Mason used an initial bolus of 2 μ(mu)g/kg over 10 min (repeated if Ramsay sedation score [47] of 4 not reached) followed by an infusion at 1 μ(mu)g/kg/min, in 62 patients with mean age 2.8 years and mean weight 15 kg, undergoing CT imaging [23]. Of these patients, 10 % were able to undergo their scan during the initial loading dose, 16 % required a second loading dose, and 90 % required the maintenance infusion. Two patients became agitated during the loading dose and were given alternative agents for sedation.
Subsequently, Mason reported the results of a study of the use of higher doses of dexmedetomidine in >700 patients undergoing MRI scanning, which is more stimulating, and in which movement causes significant image degradation [24]. With time their regimen evolved from an initial bolus of 2–3 μ(mu)g/kg and from an initial infusion rate of 1 μ(mu)g/kg/h to 1.5 and 2 μ(mu)g/kg/h. The highest doses were associated with successful sedation and image acquisition in 97.6 % of patients, but with reasonable cardiorespiratory safety.
Koroglu and colleagues used smaller doses for sedation during MRI scanning in 30 children with a mean age of 4 and mean weight of 14 kg; the bolus dose was 1.0 μ(mu)g/kg over 10 min, and this was followed by an infusion at 0.5 μ(mu)g/kg/h initially, but increased to 0.7 μ(mu)g/kg/h if a Ramsay score of 5 was not reached within 25 min [22, 24]. With this regimen, additional midazolam was required in 16 % of patients to facilitate successful scan completion.
Target Controlled Infusions
Definition
A TCI is an infusion of a drug administered by an infusion pump controlled by a computer or microprocessor that is programmed to calculate and implement the drug infusion rates required to achieve in a patient the blood or effect-site concentrations required by the user. Simply put, with these systems, the user inputs a desired “target” concentration, and the system uses the parameters of a pharmacokinetic model for that drug and the patient parameters included as covariates in the pharmacokinetic model to calculate the infusion rates estimated to be necessary to achieve that concentration.
Rationale for TCI
As previously explained, bolus doses of intravenous drugs for sedation are generally only suitable for short procedures. Although infusions do provide more stable conditions, they still do not provide stable blood concentrations. Even for propofol, a drug with rapid kinetics, blood concentrations continue rising for several hours when fixed rate infusions are used (see Fig. 31.7). There is thus a poor correlation between infusion rate and clinical effect. During the course of any procedure, the effect-site concentration required for adequate sedation will vary widely according to several other factors such as the influence of co-administered drugs (especially opioid analgesics), the onset of natural sleep, changes in the environment, and the severity of any noxious stimuli. The changing relationship between infusion rate and effect-site concentration, and the delay in blood–effect-site concentration equilibration, makes rational, precise, and rapid titration of the infusion very difficult. As can be seen in Fig. 31.7, stepwise changes in the infusion rate of 2 mg/kg/h result in very slow changes in blood and effect-site concentrations, so that it is difficult to assess the response to an infusion rate adjustment. These difficulties form an important part of the rationale for TCIs, where a computer or microprocessor is used to implement the infusion rates required to maintain steady-state blood concentrations. Since steady-state blood concentrations arise quite quickly, TCI systems allow the user to judge the clinical effect of a blood concentration and to then adjust the target blood concentration accordingly, rather than adjusting the infusion rate accordingly. An analogy is to compare the control a car driver has over the speed of his car, when he has a speedometer and cruise control system versus the control he would have with only a gas pedal and no cruise control system or speedometer.
When k eo values for children have been validated and effect-site targeting is sufficiently developed for use in children, then a further refinement will be added since users will then be able to titrate the effect-site concentration titrate according to observed patient responses.
With blood and effect-site concentration targeting, absolute accuracy of the pharmacokinetic model is not important, since steady-state concentrations arise very quickly, and there remains wide variability in pharmacodynamic sensitivity among different patients to given blood and effect-site concentrations. Thus, even with the most accurate models and systems, titration according to pharmacodynamic responses will be required.
Principles of TCI
With TCI the user is able to set and alter a desired “target” drug concentration. The target is usually a blood concentration (although algorithms do exist for effect-site targeting [48] and have been implemented for propofol, remifentanil, and sufentanil use in adults). TCI systems use compartmental pharmacokinetic models with complex mathematical algorithms to calculate and implement the infusion rates required to achieve the target concentration. The system software calculates the drug amount in each of the compartments every 10 s, taking into account the amount of drug infused over the previous 10 s, the movement of drug into and out of the central compartment by redistribution, and the rate of removal of active drug from the central compartment by metabolism or elimination. It then calculates and implements the infusion rate required to maintain the target concentration over the subsequent 10 s.
Stay updated, free articles. Join our Telegram channel

Full access? Get Clinical Tree


