Ultrasound (US), which for a long time was considered as operator dependent, left little place for the images themselves. Recent legal developments in countries like France have changed this, requiring that the images taken from a US session be used in final reports concerning the patient.
To do this we must master:
After reviewing the physical and biologic characteristics of US we will explain those elements that fine tune our equipment allowing an examination based on, and providing, the best possible imaging.
The physical principles of ultrasound as applied to fetal ultrasound
Tissue elasticity
The stimulation of the US probe’s crystals provokes a mechanical deformation of its surface, compressing the skin gradually, and then the underlying structures. The elasticity of these deformed structures provokes a return to their original form. This new deformation brings about, on the tissues that are passed over until the probe’s return, a variation of pressure which is the inverse of the initial pressure.
This is the same principle that applies to the compression of a bicycle air pump’s piston when it prevents the air from leaving: the moment there is a release the piston rises. The speed of the return varies as a function of the force of the initial compression, but this is also due to the elastic characteristics of the element that is compressed, in this case, air.
Example of tissue elasticity
In this four-chamber view (Fig. 2.1), the US wave crosses tissues that present with different echogenicities in relation to their elasticity:
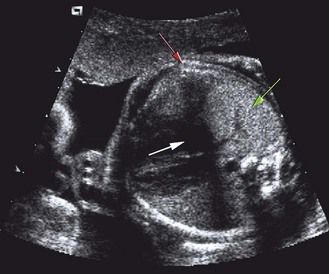
Figure 2.1 There are three different kinds of echogenicity. Anechogenic (nothing to bounce the US, which is represented in black: white arrow), hyperechogenic (most or all the US bounces off a hard structure so that it is represented in black and white as if all is reflected or absorbed: red arrow), and echogenic (intermediary hardness of the structure; the US bounces a little and is represented in gray: green arrow).
Reflection of ultrasound
Ultrasound acts like light: on smooth surfaces, which are sufficiently large, the reflection of the waves occurs as with a mirror. The images will be sharp if we are directly in front of them, and they will be invisible if the angle is too great. In the latter case (Fig. 2.2) the image has been reflected away from the probe, translating into an image which is anechoic.
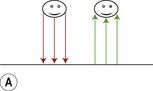
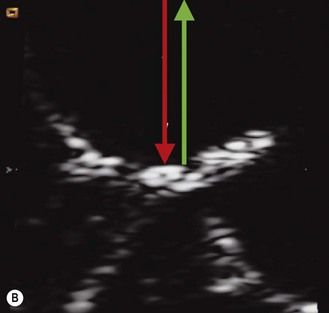

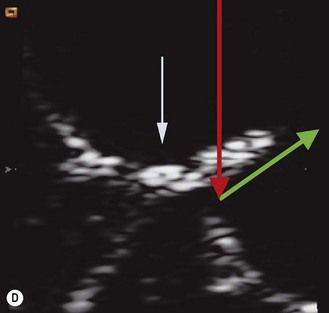
Figure 2.2 Reflection on a smooth surface can be compared to a mirror. A, B. If the US incidence is perpendicular to a smooth surface of the target, the direction of the reflected wave will be the same, thus it will return directly to the probe. This applies to the crux of the heart. C, D. If the angle is different, the entire wave is reflected away from the probe, as shown here. This also applies to the crux of the heart.
If the surface encountered is not smooth, the resulting image will be correspondingly less sharp, such as with frosted glass, because of the “scattering” of the reflected wave (Fig. 2.3).
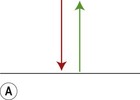
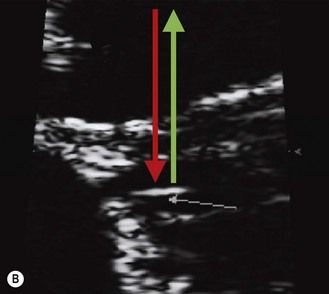
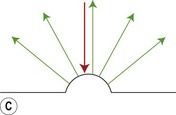
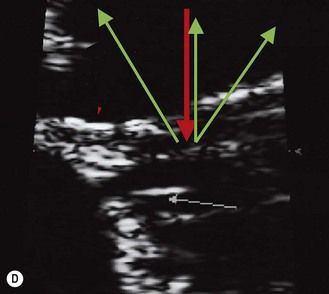
Figure 2.3 Reflection as a function of the surface of the target. (A, B) If the surface is smooth, most of the wave will be reflected in the same direction. This applies to the chordae. (C, D) If the surface encountered is not smooth, the resulting image will be equally less sharp with a diminished power, such as with frosted glass “scattering” a reflected wave. This applies to a jagged surface.
It is important to understand that by increasing the frequency of the probe we can use the reflection, without diffusion, of a smaller surface so that intense echoes will be produced.
If by increasing the frequency we can improve the image, it is at the cost of creating a false diagnosis of hyperechogenicities (intestinal and renal—most importantly at the beginning of a pregnancy when we are most tempted to use elevated frequencies).
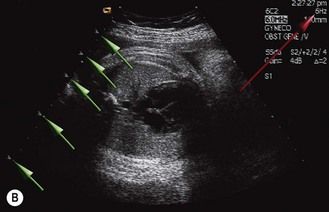
In the study of a smooth surface like that of the interventricular septum (IVS), the lateral approach on the four-chamber view is preferential. The interface of the myocardium and endocardium becomes more marked and the image of the chordae more distinct than the myocardial wall. The markers are clearer, giving us a very echogenic visualization because of the endocardium, and the measure of the thickness will be more precise (IVS in the case of a gestational diabetes) (Fig. 2.4).
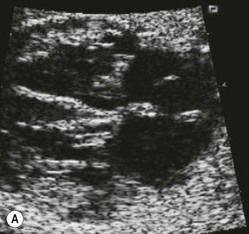
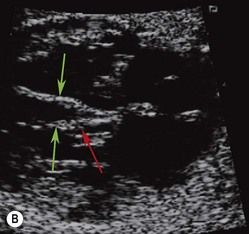
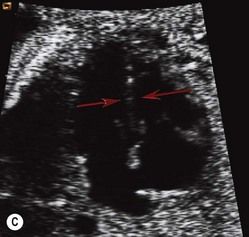
Figure 2.4 Cardiac application. (A) In the study of a smooth surface like that of the IVS, the lateral approach on the four-chamber view is preferential. (B) The interface of the myocardium–endocardium becomes more marked (green arrows). In this approach an important pitfall has to be avoided. The image of the chordae is more distinct than the myocardial wall allowing it to be confused with the endocardium, giving the impression of an increased thickness of the septum (red arrow). (C) On the contrary, an apical view will limit our view of the septum (red arrow).
It is always advantageous to use perpendicular incidences in looking at interesting structures. This allows us to “highlight” the small smooth surfaces that would be invisible in the case of an oblique incidence.
The principle of the shortest path
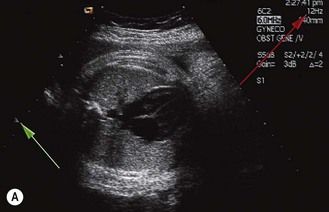
The attenuation that limits exploration is in function of the quality or nature of the tissue, but also the quantity of the tissue that is passed through (Fig. 2.5).
The path we choose is a function of the obstacles that we confront.
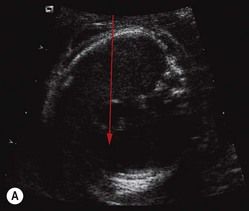
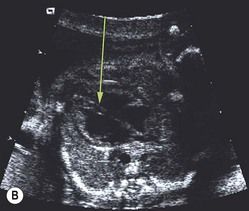
Figure 2.5 The shortest path. As an exercise we can search for the approaches that limit the distance to the fetus, positioning the left thorax in front in order to facilitate our study of the heart. (A) This difficult path provides poor visualization of the heart, the tissue associated with the ribs causing an important attenuation (red arrow). (B) Often after studying the spine, pressure on the back and kidneys will cause the fetus to move, allowing a better pathway with less attenuation for the examination of the heart. There will be less tissue thickness (green arrow) and fewer obstacles will greatly decrease the attenuation as well.
Going around obstacles
The more the US beam meets obstacles, the more the wave is attenuated, weakening equally the incident and reflected beam and thus finally reducing the information that can be furnished by the reflected waves. The attenuation depends on the structure of the obstacle, going from a discrete hypoechogenicity to an US wall, blocking the US and, generating impassable shadow zones, as with calcification.
Conversely, we can use these anechoic zones to facilitate the propagation of US.
In this spirit, we look for “acoustic windows” to obtain the best image, for instance using the form of a liquid near our target area to better frame the target itself (Fig. 2.6).
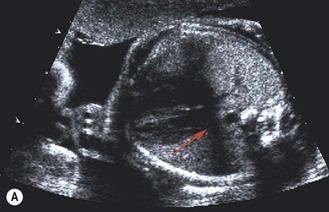
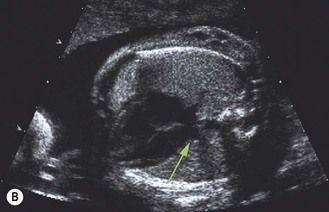
Figure 2.6 Going around obstacles. (A) A cone of shadows masking the right inferior venous return (red arrow). (B) Going around the rib to finally arrive at this vein (green arrow).
US can always be described as a “fight against time.” There is always a compromise between the time and the quality that we are trying to obtain. (It does not matter if we are on vacation or in a rush, one hour always equals 60 minutes.)
We must also remember that the speed of the US propagation is independent of the constants that we may have chosen.
This speed is constant at 1560 m/s; one wave of US always has the following characteristics:
There is a limited time to emit and receive. We know that the crystal has two phases—emission and reception—which can never occur simultaneously.
At the same time we must realize that the sharpness of the final image depends on the number of points taken to form it.
Each point corresponds to a round trip of the US wave between the probe and the structure it represents.
To improve the frame rate, we choose those settings, from a series of parameters, which reduce useless time loss in relation to what we are looking for. These parameters are as follows:
What takes time?
The surface to be explored
The larger the surface explored and the greater the number of beam lines will vastly increase the number of pulsations to far more than what is needed. This will increase the time taken to form the image to the point that the frame rate will be greatly diminished.
It is necessary for us to limit the fields explored in our zone of interest in order to increase frame rate.
The number of crystals stimulated
This number depends on the size of the field. The greater the number of crystals stimulated, the more time we need to obtain the image. If we choose a narrow field, fewer crystals will be stimulated and this allows us to:
Most machines allow for a lateral reduction of the field programs concerning the heart.
Distance traveled from the point of view of time
The deeper the field of exploration, the greater the wave trajectory. The user has no choice but to wait.
Some US machines limit the time of reception of echoes to those that are coming from the field being zoomed.
This gives a time advantage which can be used for increasing the frame rate and the quality of the image (by using those settings that reduce time consumption, such as the density of beam lines or the number of focal zones).
The number of focal zones
This control is often forgotten but has to be constantly adapted to the situation. This setting can optimize US since the loss of quality can be very important if the zone of interest is far from the focal zone, notably with the very high frequencies that are used in the endocavity examination.
Something that is often overlooked—but which should be attended to when the position of the focus has been correctly adjusted—is that each sweep will be more and more precise in the small horizontal band corresponding to the focal zone. It is possible to increase this band by making several sweeps, each with a different focal band. In proceeding like this, we keep only the different focal bands from each sweep, which we will then combine to create the final images. When an image is constructed in this fashion it obviously takes more time to acquire (Fig. 2.7).
If the zone of interest is reduced and limited to the proper extent this constant can be overlooked. In doing this the US equipment will automatically adjust its maximal focal zone to the zoom which will then be entirely within this focal zone.
The use of color Doppler
The use of the Doppler effect allows us to detect the presence of movement. These then allow us to quantify direction and speed by studying the variation of the frequency undergone by the incident wave on a moving target.
Color Doppler is the greatest “time eater”. Each pixel (the unit measure of each point of color) represents a pulse. Each pulse analyzes the variation in the frequency of the reflected wave provoked by the movement of each small target (whose size is only one pixel). To do this we must add the time necessary to take the 2D image.
This explains the interest in reducing, to the greatest extent possible, the surface explored in color Doppler; the time that is gained can then be used to increase image cadence or quality.
By the same mechanism, the reduction of the 2D field—even if it is less efficient than color Doppler to keep an image cadence that is satisfactory—should not be overlooked when we are studying the heart.
The time taken by Doppler in pulsed or color modes has led manufacturers to propose an independent freeze for each of these modes (in general 2D) leaving more time for what is left (in general either color and/or pulsed Doppler). Certain manufacturers refuse to use the triplex mode (2D, pulsed Doppler, and color) in order to preserve the best image quality.
The physical principles of doppler
Doppler color and time
Movement can be studied with four Doppler modes, as follows.
Continuous Doppler
This is created by variations in the frequency of reflected waves from all the tissues that are passed through by a line that is perpendicular to the probe’s crystal. All these frequency variations are represented on the same curve, as if the two targets are moving in opposite directions. However, this mode is not used in obstetrics.
Stay updated, free articles. Join our Telegram channel

Full access? Get Clinical Tree


