Fig. 7.1
X-ray (a), angiography (b), and CT (c) images used for assessing tumor involvement of the epiphysis. (d) A bone scan of a different case showing an epiphysis free of tumor
Careful histological examination of all the resected pieces was performed, especially of the metaphyseal margin in cases in which the epiphysis was preserved.
The proximity of the tumor to the growth plate was evaluated with as many of the different methods as possible. A tumor was considered to be at distance zero if it was in contact or had crossed the growth plate. On the basis of the histological findings, we studied the following statistical parameters of the four imaging methods: sensitivity, specificity, accuracy, and positive and negative predictive values.
7.3 Results
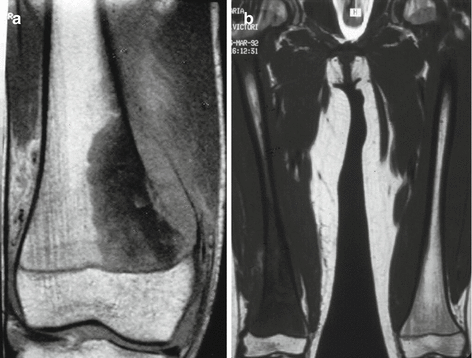
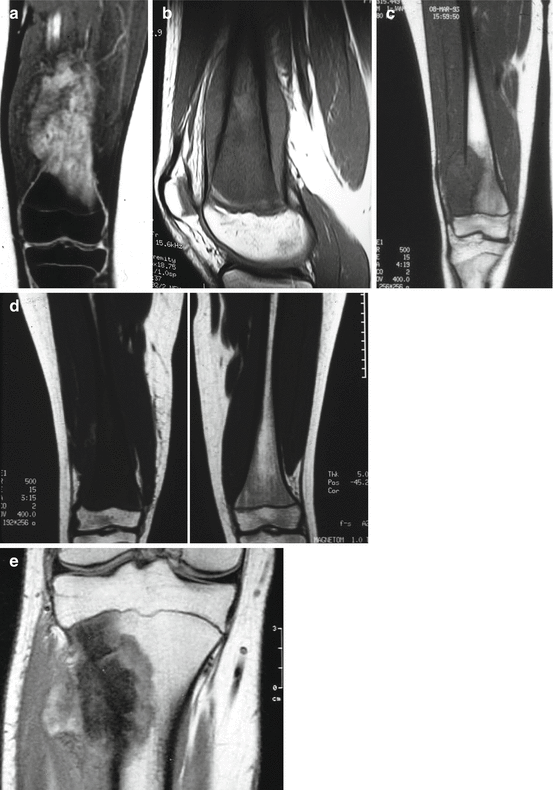
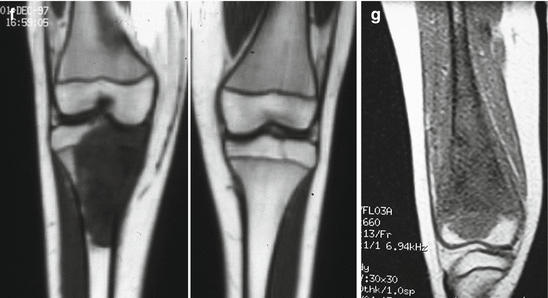
The physis was affected in 53 % of cases (Figs. 7.2 and 7.3). Table 7.1 presents the relationship between histological findings and the evaluation of growth plate involvement based on the different imaging methods.


Fig. 7.2
MRI was the best imaging method for assessing tumoral involvement of the growth plate. T1 weighted images of patients with metaphyseal osteosarcoma showing extensive contact with the physis, but without epiphyseal involvement


Fig. 7.3
In 50 % of the cases (a–e), the physis was not crossed by the tumor. In the other cases, the tumor had introduced itself into the epiphysis (f, g)
Table 7.1
Relationship between imaging and histological findings
No of cases studied with every imaging method | False (−) | False (+) | Total |
|---|---|---|---|
X-ray (65) | 1 | 6 | 7 (10.7 %) |
CT (43) | 0 | 6 | 6 (13.9 %) |
Angiography (30) | 1 | 3 | 4 (13.3 %) |
MRI (31) | 0 | 3 | 3 (9.6 %) |
The sensitivity with CT and MRI was 100 %, with X-ray and angiography, over 90 %. The specificity with MRI was 78.5 %.
Predictive value and accuracy data is given in Table 7.2. The positive predictive value (the probability of actual involvement of the growth plate given that with the imaging method it was seen to be involved) was more than 80 % for all the methods studied. The negative predictive value (the probability that the imaging method correctly indicated that the growth plate was not involved) was 100 % in CT and MRI. The greatest accuracy (the average of the positive and negative predictive values) was obtained with MRI (90.3 %). With MRI, we found that it was possible to distinguish three types of lesion:
Table 7.2
Accuracy of the imaging methods
Imaging method | PPV | NPV | Accuracy |
|---|---|---|---|
X-ray | 82.7 | 94.7 | 87.5 |
CT | 81.5 | 100 | 86.5 |
Angiography | 85.1 | 80 | 84 |
MRI | 87.1 | 100 | 90.3 |
The tumor was not in contact with the growth plate. In some cases, the radiologist could discern edema between the tumoral lesion and the growth plate, and this was an important feature in determining the surgical approach.
The tumor was in contact with part or all of the growth plate. In some of these cases, it was possible to resect the tumor while preserving the epiphysis (see Chap. 9).
Stay updated, free articles. Join our Telegram channel

Full access? Get Clinical Tree


