Chapter 8 Growth
What Are the Key Points I Need to Know about Growth?
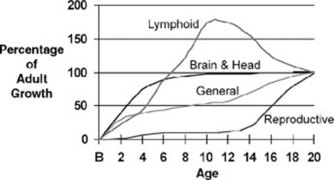
The overall health of an individual affects growth and pubertal maturation through complex interactions among diseases, nutrition, and the growth process. In general, as nutrition, control of diseases, and general public health improve, populations become taller and heavier and demonstrate earlier sexual maturation. Standardized growth charts reflect the population norms and are used for ongoing surveillance. Figure 8-1 shows human growth patterns.
Stature and weight change most rapidly in infancy and again during puberty. Statural growth ceases at the end of puberty, although weight may change throughout life. Weight gain is influenced by genetic, nutritional, and behavioral factors.
Genital growth proceeds slowly until puberty, when it accelerates and goes through predictable stages, reflecting physiologic maturation.
Head circumference (HC) increases as the brain grows rapidly in the first 2 years of life. HC growth then slows and reaches a plateau after ages 4 to 6 years.
Developmental and cognitive growth continue throughout life and reflect brain and neurologic function.
Lymphatic tissue has a predictable growth pattern that peaks just before puberty, reflecting exposures to infectious agents.
How Do I Measure Growth?
Most of the time, growth is measured and plotted onto growth charts by the staff of a well-functioning office or inpatient service. Deviations from expected patterns will demand interpretation and decision making. You must review growth charts for every patient, record the data in all clinical notes, and interpret the plotted points for head circumference, weight, and length or height. You will also need to consider an infant’s weight-for-length and an older child’s body mass index (BMI). You may be asked to make the measurements and plot the data, so observe experts taking growth measurements whenever you get the chance.
How Do I Document Growth?
Growth data are plotted on growth charts (www.cdc.gov/growthcharts/) that are gender- and age-specific. The child between 2 and 3 years of age can be plotted on either the “infant” growth chart (birth to 36 months) or the “child” growth chart (2 to 20 years). Percentiles for stature differ on the two charts because an infant is measured supine, whereas a child is measured standing. You must take the measurement technique into account when you decide which chart to use. Growth charts have also been developed for specific populations, such as those with Down syndrome, Turner syndrome, and achondroplasia. (See The Harriet Lane Handbook, pp 600–608.)
Do Genetic and Disease Factors Influence Growth?
The ultimate stature (height) of an individual is genetically determined and usually reflects the stature of the parents, if the child is healthy. Predicted stature for healthy children approximates “mean parental height”:
where k=5 inches in the English system and k=13 cm in the metric system.
Growth patterns also tend to “run in families,” especially if growth accelerates relatively late, as occurs with constitutional delay of growth. Parents may tell you that they were the shortest in their age group until a growth spurt occurred in high school. Key to assessment of this type of growth pattern is recognition that growth does not plateau; it follows the curve in an upward direction, even though in a percentile range lower than anticipated based on parental mean height. Genetic factors may also influence height adversely, especially when parents are both short, or in the case of disorders such as Turner and Down syndromes. Prenatal factors such as placental insufficiency and fetal alcohol syndrome cause in utero growth retardation, which may affect ultimate adult stature. Disease may adversely affect ultimate stature, as will extreme dieting during the adolescent growth spurt.

Stay updated, free articles. Join our Telegram channel

Full access? Get Clinical Tree

