Fig. 4.1
Results of studies on obsessive-compulsive disorder and their 95 % confidence intervals included in the meta-analysis by Swets et al. (Figure reprint with permission Swets et al. (2014))
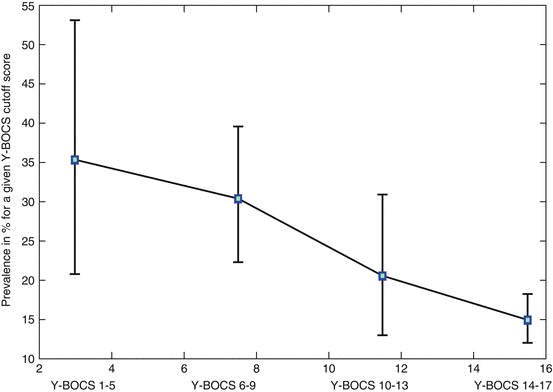
The pooled prevalence rate of 30.7 % (95 % CI, 23.0–39.6 %) for the OCS category was considerably higher, suggesting that almost every third patient with a psychotic disorder reported subclinical obsessive, distressing, intrusive thoughts and/or compulsions (e.g. repeated handwashing, checking behaviour, counting or cleaning). Accordingly, mean prevalence estimations depended on different diagnostic thresholds used to define OCS: YBOCS threshold 1–5, mean prevalence of 35.3 % (95 % CI, 20.9–53.1 %); threshold 6–9, mean prevalence of 30.3 % (95 % CI, 23.9–37.6 %); threshold 10–13, mean prevalence of 20.5 % (95 % CI, 12.9–30.9 %); and threshold 14–17, mean prevalence of 14.8 % (95 % CI, 11.9–18.2 %) (see Fig. 4.2) (Swets et al. 2014).


Fig. 4.2
Prevalence (in %) for different YBOCS threshold severity scores. The figure indicates the average prevalence and error bars (±1.96 SD) (Figure reprint with permission Swets et al. (2014))
In addition to the meta-analytical review of previous studies, Swets et al. recently evaluated the occurrence of OCS/OCD in the large multicentre Genetic Risk and Outcome of Psychosis (GROUP) study, a prospective investigation of a representative cohort of patients, their nonpsychotic siblings and healthy controls in the Netherlands. Overall, 2,526 subjects were included in one or more analyses (987 patients and 973 siblings, coming from 978 families, and 566 controls). In concordance with the mentioned pooled prevalence rates resulting from meta-analysis, they found clinically relevant OCS (YBOCS > 9) in 19.0 % of patients. This number highly exceeded the occurrence of clinically relevant OCS in siblings (4.3 %) and healthy controls (1.6 %) (M. Swets et al. unpublished data).
Although distinguishing between OCD and OCS and addressing different severity thresholds partly explain the heterogeneity of previous results, the variability of prevalence rates within the OCD and OCS categories was still significantly high (see Fig. 4.2). Therefore, Swets et al. conducted additional meta-regression analyses to identify potential moderators. In line with findings by Achim et al., again stage of illness, the applied DSM version (DSM-III vs. DSM-IV), used diagnostic instrument (DIGS vs. SCID) and application of supplement assessments specifically addressing OCS (e.g. the YBOCS) were associated with the level of reported OCD rates. These variables explained almost 60.0 % of the heterogeneity across studies. After adjustment, the overall OCD prevalence changed from 12.3 to 13.6 %. The confidence interval narrowed accordingly, now ranging from 11.8 to 15.8 %. With respect to the OCS prevalence estimates, only the additional assessment with symptom-specific instruments retained a statistically significant association. This variable explained 27.1 % of the heterogeneity, leading to an adjusted overall OCS prevalence in 30.3 %, with a narrower confidence interval ranging from 24.2 to 37.3 % (Swets et al. 2014).
4.1.2 Prevalence Estimations for Different Stages of the Psychotic Disorder
Both meta-analytical studies mentioned illness duration as a significant moderator with prevalence rates in later disease stages being significantly higher than in the early course of psychotic illness. Consequently, separate analyses of prevalence estimations in different stages of the psychotic illness could be a useful approach in further explaining heterogeneity of reported results.
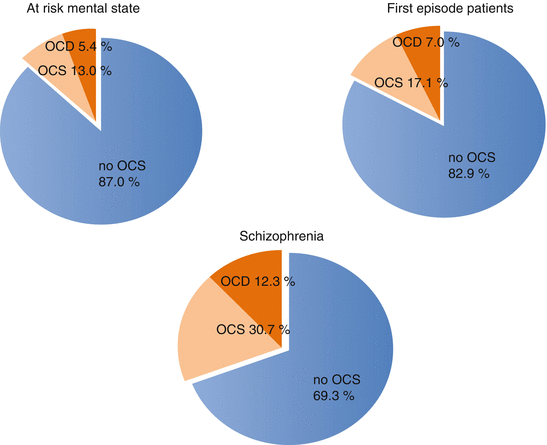
In a recent study, Zink et al. published data on OCS and OCD occurrence in an at-risk mental state (ARMS) sample and reviewed existing data of prevalence rates in the early course of psychotic illness (see Table 4.1). Including their findings in the calculation of sample size weighted mean prevalence rates, 13.0 % (95 % CI, 10.8–15.5) of ARMS patients report OCS, while 5.4 % (95 % CI, 4.5–6.5) fulfil the criteria for OCD. Slightly higher averaged rates for OCS (17.1 %, 95 % CI, 14.6–19.8) and OCD (7.0 %, 95 % CI, 5.7–8.6) were found in first-episode patients (see Fig. 4.3). Thus, in comparison to the general population, a remarkably large subgroup of patients already reports OCS during the early course of psychotic illness (Zink et al. 2014). Again, variability of epidemiological data between studies can be explained by methodological aspects, including differences in the definition of ARMS criteria and differences in the psychometric assessment of OCS or OCD.

Table 4.1
OCS/OCD prevalence rates in ARMS and FEP patients
Cohort size (n) | OCD (%) | OCS (%) | |
|---|---|---|---|
ARMS | |||
Lencz et al. (2004) | 82 | 11 | |
Rosen et al. (2006) | 29 | 4 | |
Shioiri et al. (2007) | 219 | 1.5 | 2.7 |
Rubino et al. (2009) | 197 | 8.1 | |
Niendam et al. (2009) | 64 | 14 | 20 |
Sterk et al. (2011) | 29 | 3.4 | 20.7 |
Fontenelle et al. (2011) | 396 | 8.1 | |
Bechdolf et al. (2011) | 156 | 3.8 | 11.1 |
Hur et al. (2012) | 65 | 36.9 | |
De Vylder et al. (2012) | 20 | 30 | 60 |
Fusar-Poli et al. (2012) | 509 | 2 | |
Zink et al. (2014) | 233 | 5.2 | 11.2 |
FEP | |||
Poyurovsky et al. (1999) | 50 | 14 | |
Strakowski et al. (1993) | 27 | 7.4 | |
Strakowski et al. (1995) | 18 | 11.0 | |
Craig et al. (2002) | 225 | 4.0 | 16.9 |
106 | 15.0 | 29.2 | |
De Haan et al. (2004) | 200 | 7 | |
Sterk et al. (2011) | 270 | 1.5 | 10.7 |
De Haan et al. (2013) | 198 | 11.6 | |
De Haan et al. (2013) | 186 | 11.8 | 31.2 |

Fig. 4.3
Prevalence rates for different stages of psychosis
In comparison to OCD prevalence rates in early stages of the disease, the mentioned co-morbidity rates in mixed and later disease stages are considerably higher, frequently exceeding estimations of more than 30 % (Lysaker and Whitney 2009; Sevincok et al. 2006). This finding is in line with the general assumption that more severe psychopathology is characterized by higher levels of co-morbidity. Furthermore, several case reports, cases series and systematic evaluations reported the de novo development or marked aggravation of OCS during treatment with atypical antipsychotics, in particular clozapine (Mukhopadhaya et al. 2009) (see Chap. 10). High prevalence rates of up to 70 % in groups treated with clozapine markedly contrast with lower prevalence and severity of OCS, for example, in patients treated with haloperidol or other second-generation antipsychotics (de Haan et al. 1999; Schirmbeck et al. 2011, 2013; for a review, see Schirmbeck and Zink 2013). The fact that chronic patients are more likely to use clozapine may partly explain the higher co-morbidity rates in later disease stages. Another explanation may be that the propensity to develop antipsychotic-resistant psychotic symptoms is associated with the risk to develop OCS.
In summary, meta-analyses highlight the fact that obsessions and compulsions are highly prevalent in patients with psychotic disorders and require specific attention. The noticeable heterogeneity in prevalence rates throughout cross-sectional studies can be attributed to several factors such as the levels of symptom severity, stage of the psychotic illness or methodological differences. Taking symptom severity into account, Swets et al. concluded that around 30 % of patients with a psychotic disorder experienced broadly defined OCS, 20 % experience at least mild OCS and 12 % fulfil the criteria for a co-morbid OCD. The evaluation of prevalence estimations at different stages of psychotic illness reveals an increase in co-occurring OCS/OCD with longer illness duration.
4.2 Differences in Pattern of Onset and Clinical Course
Apart from differences in first manifestation of co-occurring OCS/OCD, little is known about the longitudinal course of symptoms over time. Prevalence estimations based on the presence of OCS/OCD at one cross-sectional assessment or based on short-term retrospective assessments do not account for the fact that OCS may appear as fluctuating symptoms that they may remit, relapse or worsen over time. To provide a more realistic lifetime estimate of occurrence and persistence of OCS/OCD in schizophrenia, detailed longitudinal assessments are needed. This data will further aid to provide information on the course and possible interactions of symptoms.
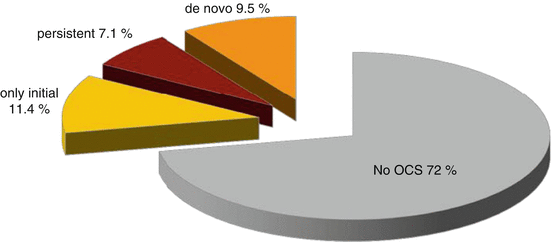
To date, only few studies prospectively assessed the course of co-morbid OCS/OCD over time. Craig et al. reassessed schizophrenia/schizoaffective patients 24 months after inclusion and found remission of baseline OCS/OCD in two-thirds of their investigated sample. Concomitantly, during follow-up, there was an incidence of newly reported OCS and OCD roughly equal to about one-third of the lifetime prevalence rate found at baseline (Craig et al. 2002). In line with these findings, a recent study of a large sample of first-episode patients (n = 172) showed considerable fluctuation in co-morbid OCS/OCD over a period of 5 years. The point prevalence for OCS at admission was 32.2 %; the 5-year prevalence rate for OCS was 51.1 %, with only 13.4 % reporting OCS at all four assessments (de Haan et al. 2012). Similarly, the vast majority of co-morbid patients of the earlier mentioned GROUP study reported symptom changes either as remitting, de novo development or intermittent OCS over the first 3 years of prospective investigation (see Fig. 4.4) (F. Schirmbeck et al. unpublished data). In contrast, a 1-year observational investigation of a subgroup of schizophrenia patients treated with clozapine or olanzapine found remarkable persistence in reported OCS over time (Schirmbeck et al. 2013).


Fig. 4.4
Course of obsessive-compulsive symptoms over 3 years
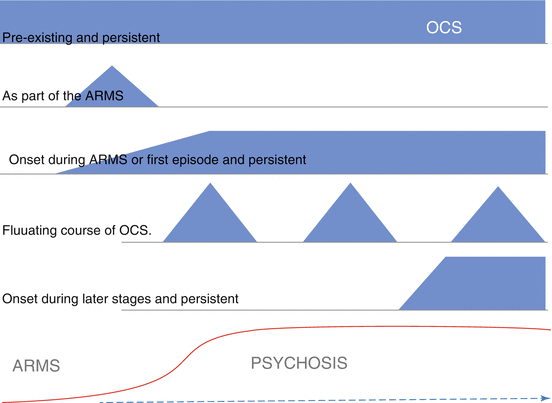
As a result of reported findings, different types of OCS onset and development over time have been proposed (see Fig. 4.5).


Fig. 4.5
Patterns of OCS onset and course during different stages of psychosis (Adapted from Schirmbeck and Zink (2013))
The reason for the variation in course of co-occurring OCS and substantial fluctuation in a large subgroup of co-morbid patients is not clear. Analyses within the GROUP sample revealed that changes in OCS were significantly associated with changes in psychotic symptoms, general psychopathological symptoms and emotional distress, not only in patients but also in unaffected siblings (F. Schirmbeck et al. unpublished data). These findings hint towards dynamic interactions between symptoms, but they are limited by infrequent assessments, with a large interval of 3 years in-between. Changes of affective or psychotic symptoms, transient OCS or substantial remission of OCS and most importantly the exact time course of these events are still unknown. The diverse clinical course adds to the heterogeneous clinical presentation and suggests an involvement of different pathogenic pathways in the development of co-morbid OCS in schizophrenia.
4.3 Subgroups within the Co-morbid Sample
It seems very unlikely to assume that the high prevalence rates of OCS in psychotic disorders are simply due to a random association of two rather common psychiatric disorders (Pedersen et al. 2014). The heterogeneity of the clinical presentation suggests the involvement of several pathogenic mechanisms. Progress in understanding these mechanisms will most likely be achieved if studies focus on the identification of homogeneous subgroups within the co-morbid sample. This is especially important as different aetiologies may require different treatment approaches (see Chaps. 11 and 12).
Before introducing possible categorizations within the co-morbid sample, some notions on the assumption of OCS as an attempt to compensate psychotic symptoms seem appropriate. Furthermore, the often difficult differentiation between symptoms of schizophrenia and OCS (Chap. 3) should be addressed. Early concepts on the co-occurrence of OCS and psychotic disorders proposed that OCS might develop as an attempt to reduce psychotic symptoms, might have protective effects regarding psychotic disintegration and might indicate a favourable course of schizophrenia (Dowling et al. 1995; Stengel 1945). In contrast to these assumptions, subsequent research results mainly reported negative impacts of the co-occurrence of psychosis and OCS as shown in higher general illness severity, more social and functional impairment and an overall poor prognosis (Cunill et al. 2009; Ücok et al. 2011) (see Chap. 6). However, individual studies reported negative correlations between specific OCS and certain aspects of psychosis. Guillem et al. found negative associations between somatic obsessions as well as hoarding and the severity of psychotic disorganization in thinking and behaviour and proposed compensating mechanisms (Guillem et al. 2009).
As mentioned in Chap. 3, detailed diagnostic explorations and careful discrimination between symptoms of psychosis and OCS are of critical importance (see Chap. 3), not only for the sake of consensus concerning diagnostic categorizations but also for the development and adaptation of optimal treatment approaches (see Chaps. 11 and 12). One critical aspect concerns the distinction of catatonic symptoms of schizophrenia (Fink 2013), which phenotypically overlap with obsessions and compulsions (Fink and Taylor 2001). This fact limits the discriminative validity of psychometric scales such as the catatonia rating scale (CRS) (Bräunig et al. 2000) and the YBOCS (de Haan et al. 2006; Woody et al. 1995). Here, a more precise characterization and descriptions of the natural long-term course of symptoms should be considered, as, for instance, published by Leonhard (Beckmann et al. 2000). These descriptions allow clear discrimination between OCS and catatonic symptoms.
Stay updated, free articles. Join our Telegram channel

Full access? Get Clinical Tree


