FIGURE 9.1 Normal electroencephalogram (EEG) with a clear 10 Hz posterior dominant rhythm. With eye closure, the posterior dominant rhythm becomes clearer.
During drowsiness (early stage 1 sleep) the EEG background develops busts of higher amplitude delta activity (drowsy bursts). These become longer and more persistent, and vertex waves (midline higher amplitude sharply contoured waves) occur. With stage 2 sleep, sleep spindles develop and are generally symmetric between the two hemispheres (Figure 9.2). Stage 3 or slow wave consists of high amplitude delta activity. The normal EEG cycles through the awake and sleep states and demonstrates reactivity, indicating that with auditory or tactile stimulation there is a change in the EEG background.
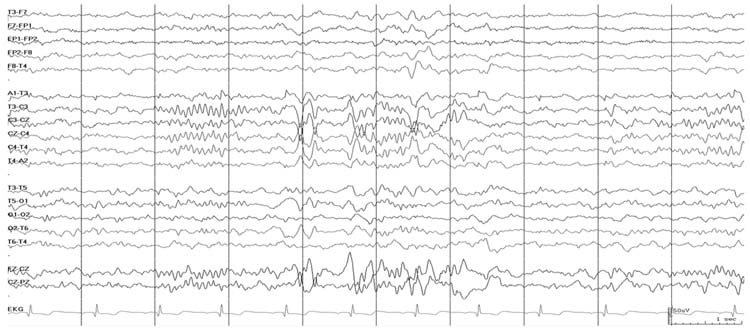
FIGURE 9.2 Normal sleep with sleep spindles and vertex waves.
■ BACKGROUND EEG ABNORMALITIES
Mild Background Slowing
Background slow activity is defined as slowing of the posterior dominant rhythm and/or overall background frequencies. A posterior dominant rhythm may be present, but may contain slower than expected activity in the posterior region. For example, a relaxed and awake teen would be expected to have an alpha frequency activity (8–12 Hz) posterior dominant rhythm, so it would be abnormal for the posterior frequency to be composed of primarily theta frequency activity (4–7 Hz). Alternatively, the overall background may be slower than expected. In this case, some normal frequencies may still be present, but there may be a greater proportion of slower activity than expected for age. For example, a relaxed and awake teen should have very little delta frequency activity while awake and should have primarily faster frequencies. Thus, it would be abnormal for the background activity to contain primarily delta frequency activity. Slowing of the overall background activity or posterior dominant rhythm is a sensitive index of encephalopathy, but is nonspecific in etiology.
Diffuse Slow Activity
Diffuse slow activity may be divided into several categories. Slowing may be continuous or intermittent, and it may be rhythmic or polymorphic. The degree of slowing may be quantified as the predominant frequency. Diffuse continuous slowing describes slower than normal activity without any anterior to posterior amplitude-frequency organization (Figure 9.3). Diffuse intermittent slowing refers to a normal background pattern or mild background slowing with intermittent excessive slow activity. Rhythmic slowing refers to bursts of rhythmic slowing and can include frontal intermittent rhythmic delta activity and occipital rhythmic delta activity. Rhythmic slowing may occur with mild background slowing or diffuse continuous slowing.
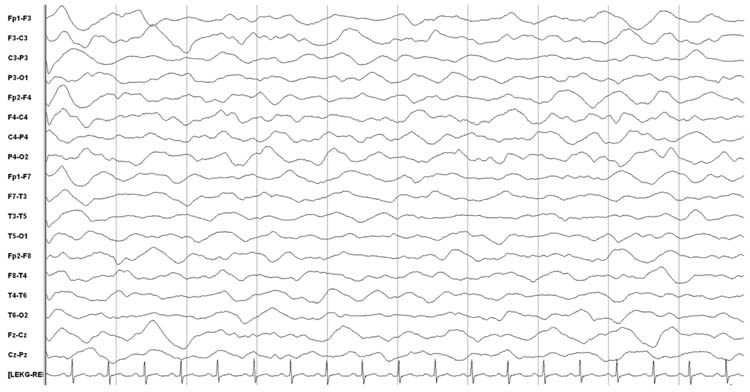
FIGURE 9.3 Diffuse polymorphic delta slowing.
These types of slowing must be distinguished from the drowsy or sleep states. Drowsy bursts are essentially bursts of diffuse intermittent slowing, and slow wave sleep is essentially diffuse continuous slowing. This issue underscores the importance of knowing the patient’s state and medications when interpreting EEG. For example, a patient who is known to be receiving sedative medications with diffuse delta activity would be interpreted as diffuse continuous slowing and not as normal slow-wave sleep. Assessing reactivity may also be important. Normal patients with slow activity as a component of sleep should demonstrate a change in the EEG (often developing faster and lower amplitude frequencies characteristic of the awake state) with stimulation. Tracking an EEG over time is also important, and distinctions may be difficult based on a single brief segment of EEG out of context. If bursts of slowing are seen in a patient transitioning from a normal awake state to stage 1 sleep this will help establish that the slow bursts are drowsy bursts. In contrast, if a patient has a persistently slow record without these normal state transitions then these slow bursts are likely diffuse intermittent slowing.
Diffuse slowing, whether intermittent or continuous, is a nonspecific coma pattern that can occur with metabolic encephalopathy, intoxication, or diffuse or specific focal cerebral lesions. Slowing may persist even after correction of some metabolic abnormalities. For example, after hyponatremia is corrected based on serum levels, disturbances in intracellular and extracellular fluid and electrolyte levels may persist. Diffuse slowing may also occur with diffuse structural lesions or focal lesions in specific regions such as subcortical white matter injury, thalamic, or midbrain tegmental lesions (20). If slowing is focal or multifocal then focal or multifocal lesions or dysfunction should be considered (Figure 9.4). Neuroimaging is generally indicated to establish the etiology of the focal dysfunction. The prognosis of diffuse slowing is dependent on the etiology.
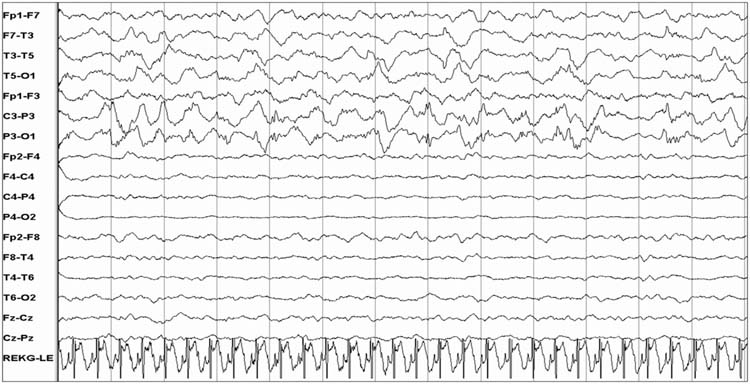
FIGURE 9.4 Diffuse polymorphic delta activity in the left hemisphere with asymmetric amplitude suppression in the right hemisphere.
Discontinuity and Burst-Suppression
Discontinuous or burst-suppression EEG patterns describe backgrounds in which there are bursts of activity alternating with periods of lower amplitude suppression (Figure 9.5). Discontinuity refers to periods of activity and suppression that are variable in duration and morphology. Discontinuity is normal in premature neonates and during sleep in term neonates, but beyond that period a normal recording is always continuous. In burst-suppression the appearance is more regular and the EEG is invariant (no spontaneous changes including reactivity to external stimulation. The bursts may contain any type of activity, including alpha, theta, delta, and beta activity, and may occur with or without admixed epileptiform discharges. For both discontinuity and burst-suppression, as the encephalopathy deepens the bursts become shorter and the interburst intervals longer. Some bursts can be separated by extremely long interburst intervals, and this is the basis for the requirement that EEGs being performed to indicate electrocerebral inactivity (ECI) must be at least 30 minutes in duration.
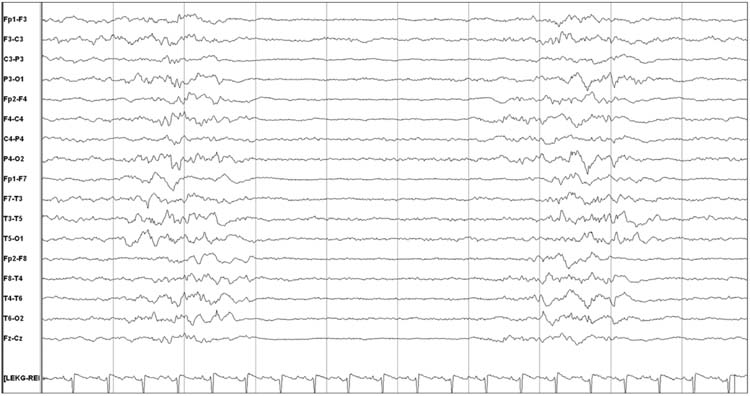
FIGURE 9.5 Burst-suppression with 1- to 2-second bursts and 3- to 4-second interburst intervals.
Discontinuity and burst-suppression are nonspecific patterns. Common etiologies include anoxic brain injury, deep hypothermia (lower temperatures than used for therapeutic hypothermia protocols), intoxication with anesthetic and sedative medications, and severe metabolic encephalopathy. Metabolic encephalopathies include hepatic encephalopathy, uremic encephalopathy, sepsis encephalopathy, hypoglycemia, hypothyroidism, Addison disease, porphyria, and Wernicke encephalopathy. Burst-suppression can occur in some epilepsy syndromes, including Ohtahara syndrome (early infantile epileptic encephalopathy) and early infantile myoclonic encephalopathy. Prognosis is dependent on etiology. When burst-suppression occurs with anoxic brain injury it suggests an unfavorable outcome, although this is not absolute and so the full clinical scenario must be considered. As recently reviewed, the burst-suppression pattern with anoxia can either worsen to an isoelectric pattern or improve to diffuse slowing (21). In a recent study of children treated with therapeutic hypothermia after cardiac arrest, the presence of a discontinuous or burst-suppression pattern during hypothermia or upon return to normothermia was associated with unfavorable outcome (22), although the study was small and EEG features were not 100% predictive. Similarly, in adults treated with therapeutic hypothermia after cardiac arrest, burst-suppression as associated with unfavorable prognosis (23). In adults, serum neuron specific enolase was higher in patients with discontinuous and unreactive EEG patterns, indicating that these EEG patterns occur in the context of permanent neuronal damage (24). In contrast, in the context of sedative intoxication, hypothermia, or metabolic encephalopathy, the EEG pattern and the patient may improve over time.
Sedatives may be used to induce a burst-suppression pattern as part of clinical management for refractory status epilepticus and elevated intracranial pressure. While evidence-based protocols to manage refractory status epilepticus are lacking, after failure of several anticonvulsants, pharmacologic suppression is often employed to induce a burst-suppression pattern on EEG. Studies have not explored whether strategies aiming to induce burst-suppression are more effective than strategies aiming for seizure suppression, and the optimal durations for bursts and interburst intervals are unknown. Patients are often maintained in burst-suppression for one or several days, and during this time other anticonvulsants are generally adjusted in an attempt to avoid recurrent seizures as the pharmacologic suppression is weaned (25,26). Second, with refractory intracranial hypertension, inducing a burst-suppression pattern may reduce metabolic demand and thus serve as a neuroprotective strategy. Again, the optimal durations for bursts and interburst intervals are unknown. It is often stated that administering additional pharmacologic suppression once the EEG is entirely suppressed is likely to provide no additional neuroprotective benefit but may be associated with more sedative adverse effects.
Low Voltage, Slow, Nonreactive Pattern
This nonspecific pattern refers to an EEG with mostly delta frequency activity, amplitude less than 20 μV, and lack of reactivity to auditory or tactile stimulation (Figure 9.6). While some normal individuals may have low-voltage tracings, their tracings are reactive to stimulation and contain posterior alpha frequencies with a normal anterior-posterior amplitude-frequency gradient. A low-voltage, slow, nonreactive pattern is generally seen with diffuse cortical and subcortical damage due to anoxic encephalopathy, severe traumatic brain injury, encephalitis, or diffuse cerebral edema. In these cases, the pattern is generally associated with an unfavorable prognosis. However, this pattern may also occur with high doses of sedating and anesthetic medications that may be associated with a more favorable prognosis.
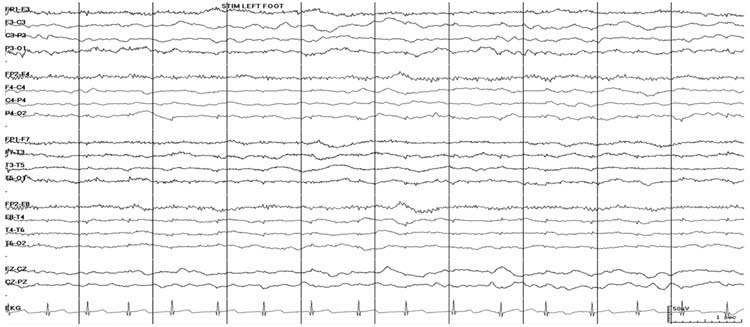
FIGURE 9.6 Low voltage, slow, and unreactive pattern. With stimulation of the foot, there is no change in the EEG (lack of reactivity to stimulation).
Reactivity to Stimulation
Reactivity describes an EEG change in response to stimulation. This may occur with standard nursing care, or with specific stimulating procedures such as auditory or tactile stimulation. Generally, a lack of reactivity to stimulation is associated with more severe encephalopathy, and at least in the context of hypoxic-ischemic brain injury is associated with unfavorable outcome in children (22) and adults (23,24,27–30). In a study of 33 EEGs from comatose children of varying etiologies with outcome measured at 1 year, outcome was unfavorable in 29% with reactive EEGs and 65% with nonreactive EEGs (31). In some patients stimulation may induce stimulus induced rhythmic periodic or ictal discharges (SIRPIDs) (32,33), but the physiologic and prognostic implications of SIRPIDs are unknown.
Electrocerebral Inactivity
ECI occurs when there is no identifiable cerebral EEG activity recorded when the EEG is performed according to specific technical criteria. When the amplitude of EEG activity is less than 2 μV, it cannot be differentiated from electrical noise. The term ECI is not used to describe focal abnormalities; the absence of electrical activity must be global. ECI must persist despite stimulation (lack of reactivity). Artifacts may still be seen on the EEG tracing, most commonly involving electrocardiac, cardioballistic, respiratory, or electrical artifacts, but these must be clearly identified as artifacts. Other terms used to describe ECI include electrocerebral silence and isoelectric EEG.
To interpret an EEG as showing ECI, the EEG must be obtained according to specific technical requirements provided by the American Clinical Neurophysiology Society (14). The EEG recording should demonstrate ECI for a minimum of 30 minutes and show no electrical activity beyond 2 μV at a sensitivity of 2 μV/mm with filter settings at 0.1 or 0.3 second at 70 Hz.
EEG may be used as an ancillary study to diagnose brain death in children. Based on the recently updated guidelines, an ancillary study is required only if (1) any components of the examination or apnea testing cannot be completed, (2) there is uncertainty about the results of the neurologic examination, or (3) a medication effect may be present. Ancillary studies, including an EEG that demonstrates ECI, may also be used to shorten the inter-examination interval required between the two brain death examinations. If the first neurologic examination and an ancillary study both support the diagnosis of brain death, the second neurologic examination and apnea test can be performed at any time (15) (see Brain Death chapter).
While ECI represents a severely abnormal EEG pattern consistent with brain death, it is not synonymous with brain death and the clinical circumstances and physical examination must be considered (15,34). Intoxication with high doses of sedating and anesthetic medications agents (eg, barbiturates, benzodiazepines, narcotics, thiopental, ketamine, halothane, and isoflurane) or hypothermia (35) may produce ECI which could be reversible.
Rhythmic Coma Patterns
Rhythmic coma patterns are reported to occur in as many as 30% of comatose children, and alpha coma is the most common rhythmic coma pattern seen in children (36). Alpha coma describes an EEG that shows predominantly diffuse monomorphic alpha activity (8–13 Hz) that usually has an amplitude of 10–50 μV (Figure 9.7). In contrast to a normal posterior dominant rhythm in which alpha activity is prominent posteriorly, in alpha coma the alpha activity may show a frontal predominance. While it is usually defined as unreactive to stimulation, some patients have reactivity (36,37), and reactivity is associated with more favorable prognosis (37,38). Alpha coma may alternate with other patterns and constitute a mixed alpha-theta or alpha-spindle coma pattern (36,39–41). The pathophysiologic mechanism underlying alpha coma is unknown. One hypothesis is that damage or depression of ascending reticular thalamic pathway produces newly generated and widespread abnormal activity related to cortical synchronization. It is important to differentiate alpha coma from a normal posterior dominant alpha pattern that is reactive to eye opening and closing and which suggests either psychogenic unresponsiveness or a locked-in state related to a brainstem lesion in an unresponsive patient (42,43).
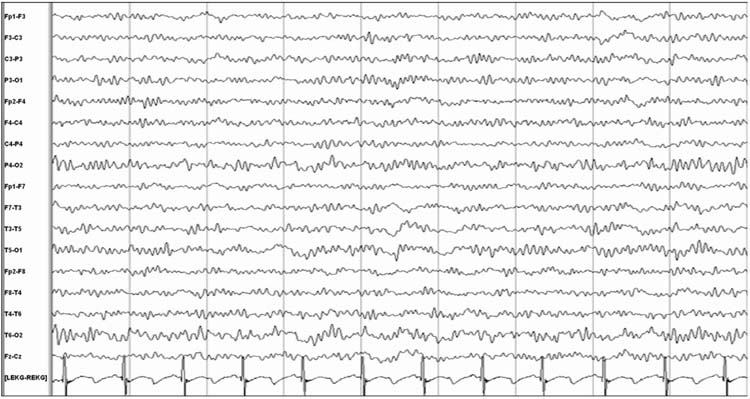
FIGURE 9.7 Alpha coma.
Alpha coma is a nonspecific pattern that may occur with toxic-metabolic encephalopathies including overdoses with a favorable outcome and anoxic brain injury with an unfavorable outcome (37). Intoxications that may produce alpha coma include benzodiazepines, barbiturates, fentanyl, nitrous oxide, isoflurane, propofol, carbamazepine (44), and imipramine (45). Flumazenil, a benzodiazepine receptor antagonist, may reverse alpha coma and improve the clinical state of patients with benzodiazepine intoxication. As intoxication resolves, the EEG evolves to demonstrate reactivity and development of a more posterior dominance alpha rhythm. Alpha coma may occur in metabolic encephalopathy including hepatic encephalopathy (36,46), hyperglycemic hyperosmolar coma (47), and septic encephalopathy (48).
Alpha coma may occur with anoxic brain injury. It is sometimes preceded, accompanied, or followed by a wide range of other EEG patterns including slowing and disorganization, theta coma, low-voltage featureless activity, burst suppression, or ECI (36). Studies have evaluated the prognostic significance of alpha following cardiopulmonary arrest. Only 1% to 3% of patients survive with nearly total or total recovery, 10% survived with neurological sequelae, and about 75% die. Outcome may be better when alpha coma appears shortly after cardiac arrest and resolves within 1 to 2 days, as compared to being detected on or after the second day. The presence of reactivity may also suggest a better prognosis (36,37). In one study, no child with an unreactive pattern had normal neurologic status on follow-up (36). Studies in children have not been conducted in large cohorts or with caregivers blinded to EEG findings. Fewer than 50 children have been described with alpha coma, and all have been as cases or retrospective case series (36,41,43,45,49–58). Studies have not determined whether use of therapeutic hypothermia following cardiac arrest impacts the prognostic significance of alpha coma.
Theta coma is less common than alpha coma in comatose children (36) and less well described. Morphologically, theta coma refers to monotonous diffuse theta (4–7 Hz) activity that is usually unreactive to stimuli. It is often admixed with other rhythmic coma patterns including alpha and spindle coma patterns (36,38–41,59–61). Like alpha coma, theta coma is a nonspecific pattern that may occur with anoxic brain injury signifying a usually unfavorable prognosis or potentially reversible metabolic and intoxication etiologies with a more favorable prognosis. In a study of rhythmic coma patterns in children (alpha, theta, beta, and spindle coma), the frequency of the pattern did not impact outcome (53). A reactive pattern carries a more favorable prognosis (38,39).
Spindle coma is a third type of rhythmic coma pattern (53). Spindle coma may occur in a paroxysmal manner admixed with primarily disorganized and slow theta or delta activity. There are diffuse, synchronous bursts of 11 to 14 Hz activity that is morphologically similar to spindles seen during sleep. Other sleep architecture including vertex waves and K complexes may be present, and on continuous monitoring, patients may cycle through stages of non-REM sleep. Spindle coma may occur admixed with other rhythmic coma patterns including alpha and theta coma patterns (36,39–41,59). The pathophysiologic mechanism of spindle coma is unclear, but some have suggested it may involve dysfunction of the ascending reticular formation leading to a combination of true sleep and coma with relatively intact cerebral hemispheres (62).
Like the other types of rhythmic coma, spindle coma is nonspecific (63,64) and may occur with anoxic encephalopathy, viral encephalitis (65) including measles encephalitis (66), intoxication (67), or metabolic encephalopathy, or with focal lesions in the pontomesencephalic junction and midbrain (68,69). One adult study reported no deaths when spindle coma was related to intoxication or seizures, 15% mortality with traumatic brain injury, 33% mortality with anoxic brain injury, and 73% mortality with brainstem and cerebral infraction and tumors (70). Prognosis is determined by etiology and has not been found to be worse with spindle coma (63,70). Outcome may be worse when brainstem motor function is impaired (64) and better when reactivity is preserved (70). Spindle coma has also been reported with more benign conditions such as vasovagal syncope (71).
Beta coma consists of generalized beta activity (12–16 Hz) that is often bifrontally predominant (Figure 9.8). This beta activity may override slower frequencies including alpha, beta, or delta frequencies. Reactivity may be present or absent. Beta coma is most commonly caused by administration of high doses or overdoses of sedative medications including benzodiazepines and barbiturates (72). Medical support is required during the acute intoxication phase, but prognosis is generally favorable. However, beta coma may also occur following anoxic brain injury with an unfavorable prognosis (36) and with acute brainstem lesions (73).
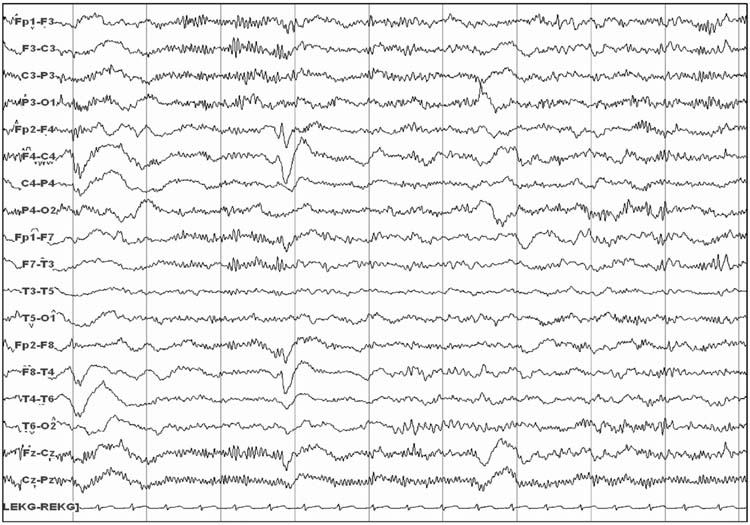
FIGURE 9.8 Beta coma.
■ SEIZURES AND STATUS EPILEPTICUS
Electrographic seizures describe seizures evident on EEG which may or may not have an associated clinical correlate (Figure 9.9). Clinical correlates may involve clear convulsive seizures or more subtle changes such as eye deviation or vital sign fluctuations. When seizures do not have any clinical change, they are referred to as NCS, and when they constitute a substantial seizure burden are referred to as NCSE. Although there is no clearly accepted definition for NCSE, one definition used in recent studies has been a single seizure lasting more than 30 minutes or recurrent seizures totaling 30 minutes within a 1 hour epoch (50% seizure burden) (74). NCS and NCSE have been reported in 10% to 40% of children who underwent long-term EEG monitoring in PICU or emergency departments (2–13). The majority of NCS and NCSE are not accompanied by any clinical change, even in nonparalyzed patients (4,9,11–13,74,75).
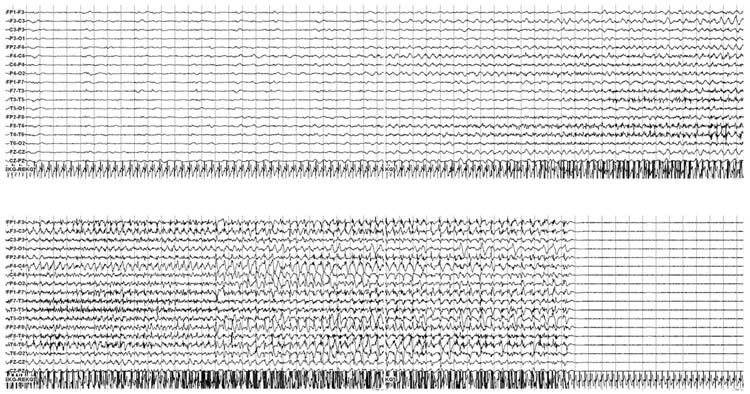
FIGURE 9.9 An electrographic seizure initiates in the right central-temporal area, generalizes, and then terminates. No clinical change was noted, constituting a nonconvulsive seizure.
Studies have described some risk factors for NCS. NCS occurrence may be much lower in children who are comatose without an acute neurologic disorder (9) than children with altered mental status and a known acute neurologic disorder (2). Children may be at increased risk for NCS compared to adults (76). Additional clinical risk factors for NCS in children include younger age (2,11), followed by convulsive status epilepticus (11) or acute seizures (12,75) with structural brain injury (12,75) including traumatic brain injury (11), then cardiac arrest (10). Electrographic risk factors include epileptiform discharges (11,75), periodic epileptiform discharges (PEDs) (4), and lack of background reactivity (4). Given the heterogeneity of risk factors, EEG monitoring is often performed in a large number of patients. In a survey of neurologists, respondents described ordering continuous EEG to screen for NCS in patients with altered mental status with prior convulsions (89%), with altered mental status and no prior convulsive (68%), subtle eye movements (85%), any patient with an acute brain lesion (47%), and any paralyzed neuro-ICU patient (47%) (77).
Studies of critically ill children indicate that about half of patients with seizures are identified in the first hour and about 75% to 90% of children with seizures are identified with 24 hours of EEG monitoring (Figure 9.10) (2,4,5,9,11,12,75,78). This is consistent with large studies of critically ill adults (76). However, these studies may be confounded by the fact that computed-analyzed EEG (cEEG) duration was not predetermined and applied uniformly to all patients. If cEEG duration was longer, NCS may have been detected later in some patients. As expected, given that some seizures occur after the initial 30 to 60 minutes of EEG recording, in critically ill adults continuous EEG monitoring has been found to identify more patients with NCSE than standard EEG recordings (79). A survey of neurologists’ current practices related to EEG monitoring in nonneonatal children and adults indicated that the majority monitor for 1 to 2 days if no seizures occur, although there was substantial variability in practice (77).
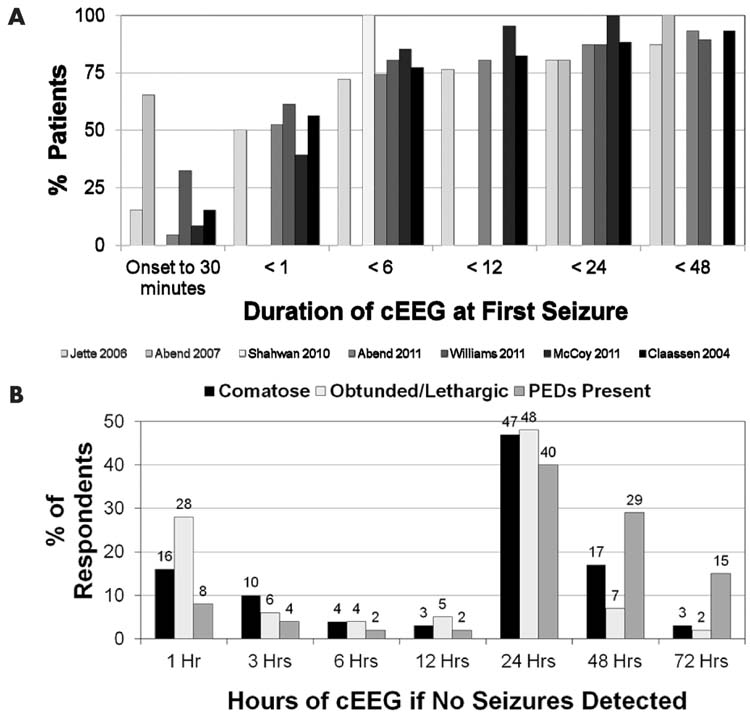
FIGURE 9.10 (A) Compilation of studies showing duration of EEG monitoring at the time of first seizure identification. (B) Survey results showing duration of EEG monitoring performed by neurologists if no seizures are identified. Adapted from Abend NS et al. Use of EEG monitoring and management of non-convulsive seizures in critically ill patients: a survey of neurologists. Neurocrit Care. 2010;12(3):382–389. PEDs; periodic epileptiform discharges.
Studies of children with specific types of acute brain injury and management may better focus the question of the optimal duration of cEEG monitoring. In a prospective study of 19 children undergoing therapeutic hypothermia after cardiac arrest, all of whom underwent urgent initiation of EEG monitoring and continued monitoring for 72 hours, no children had electrographic seizures in the initial 6 hours of monitoring (early hypothermia), one had seizures in the next 6 hours (early hypothermia), four had seizures during the next 12 hours (late hypothermia), and four had seizures in the next 24 hours (rewarming) (10). Similarly, in neonates and infants who underwent repair of congenital heart disease, electrographic seizure onset occurred at a mean of 21 hours (80). These data suggest that in specific populations the durations of cEEG may be tailored to the individual profile of the patients’ age, clinical status, and the etiology of the acute encephalopathy.
The impact of NCS is unclear. While NCS may represent a biomarker of worse brain injury, some evidence suggests NCS or NCSE may independently worsen outcome. More data is available in adults than in children. In adults, longer duration NCSE has been associated with worse outcome (81). NCS have been associated with worse discharge outcome in adults with CNS infection (82) and death or severe neurologic disability in adults in the medical ICU (83). In adults with traumatic brain injury, NCS have been associated with increases in intracranial pressure and metabolic dysfunction in adults with traumatic brain injury (84), and NCS have been associated with later ipsilateral hippocampal atrophy (85). Electrographic seizures have been associated with hemorrhage expansion in adults (86).
Several recent studies have explored the impact of NCS and NCSE on outcome in children. In 75 children, NCS is associated with higher mortality (15% versus 8%) and neurologic morbidity (31% versus 4%) (12). In a second study of 204 critically ill comatose children and neonates, 111 survived to 1 month. Among survivors, worse outcome was associated with clinically evident seizures, electrographic seizures, higher number and longer duration electrographic seizures, and a worse EEG background score. Electrographic seizures were associated with an odds ratio (OR) of 15.4 (4.7–49.7) for worse outcome in a multivariate model that contained etiology, EEG background score, Pediatric Index of Mortality, and Adelaide coma score. Further, no children had favorable outcome if they had more than 139 seizures, more than 759 minutes of total seizures, or any individual seizure lasting longer than 360 minutes (13). A third study evaluated short-term outcome in 200 prospectively enrolled critically ill children who underwent EEG monitoring if they had altered mental status and an acute neurologic problem. Eighty-four (42%) had seizures that were categorized as electrographic seizures in 41 (20.5%) and electrographic status epilepticus in 43 (21.5%). EEGs were scored as no seizures, electrographic seizures, or electrographic status epilepticus. Covariates included age, acute neurologic disorder category, prior neurodevelopmental status, sex, and EEG background category. Outcomes were mortality and worsening of Pediatric Cerebral Performance Category (PCPC) from preadmission to PICU discharge. In multivariable analysis electrographic status epilepticus was associated with an increased risk of mortality (OR, 5.1; 95% confidence interval [CI], 1.4–18; P = .01) and PCPC worsening (OR, 17.3; 95% CI, 3.7–80; P < .001) while electrographic seizures were not associated with an increased risk of mortality (OR, 1.3; 95% CI, 0.3–5.1; P = .74) or PCPC worsening (OR, 1.2; 95% CI, 0.4–3.9; P = .77). This suggests that if the seizure burden is high, it is independently associated with worse outcome (87). Further study is needed to determine whether seizure identification and management improves outcome.
If identified, there are few data to guide management of NCS and NCSE. A survey of neurologists reported that the most commonly used medications for NCS and NCSE were lorazepam, phenytoin/fosphenytoin, and levetiracetam. There was substantial variability in practice, and the second and third line medications were these same three in varying combinations. Most physicians reported escalating treatment to include pharmacologic coma induction with intubation if needed, and the most commonly used medications were midazolam and pentobarbital (77). Studies are needed to compare different management regimens and determine whether certain strategies improve outcome.
■ PERIODIC AND RHYTHMIC PATTERNS
EEGs may contain periodic or rhythmic discharges, and in many instances these are of unclear significance. These patterns do not demonstrate the unequivocal evolution in frequency, morphology, or location characteristic of seizures. Rhythmic discharges describe repetition of a waveform with relatively uniform morphology and duration, but without sufficient evolution to constitute electrographic seizures. Their physiologic and prognostic impact is unclear. Periodic discharges describe a pattern with nearly regular interval between waveforms that have a relatively uniform morphology, duration, and interdischarge interval. Common types of periodic discharges are generalized or lateralized periodic epileptiform discharges (PEDs). (Figures 9.11 and 9.12). PEDs have been associated with an increased risk of seizures (4, 10) and worse outcome (83,86,88,89). In a survey of neurologists, 63% would administer anticonvulsants if PEDs are present and occur at a frequency faster than 1.5 Hz, even if they never evolve into a seizure. If an anticonvulsant is administered, the treatment goal is to provide prophylaxis against seizures but not specifically target the PEDs for treatment (66%), aim to reduce PEDs to less than 1.5 Hz (14%), or aim to terminate PEDs (20%) (77). Rhythmic discharges and PEDs are targets of active investigation, and terminology is being developed to improve interrater agreement and foster research on their impact (90).
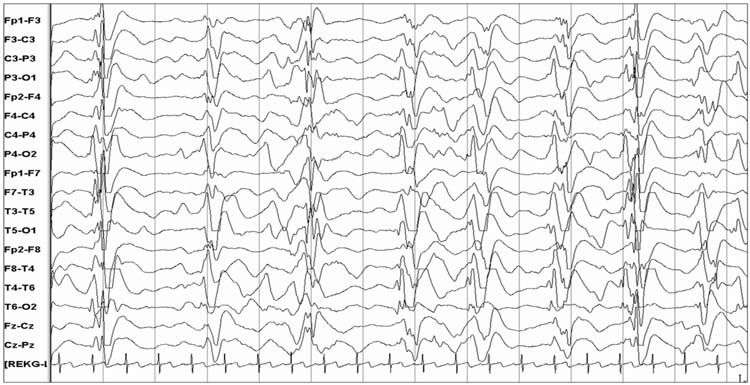
FIGURE 9.11 Bilateral periodic epileptiform discharges.
Stay updated, free articles. Join our Telegram channel

Full access? Get Clinical Tree


