Development and Identification of Tumor Serum Markers
ALEKSANDRA GENTRY-MAHARAJ  IAN JACOBS
  USHA MENON
Tumor markers are defined as molecules or substances produced by malignant tumors that enter the circulation in detectable amounts. They indicate the likely presence of cancer or provide information about its behavior. In management of cancer, the most useful biochemical markers are the macromolecular tumor antigens, including enzymes, hormones, receptors, growth factors, biologic response modifiers, and glycoconjugates. A substantial number of substances have been investigated as potential tumor markers over the past decade and the list is continually growing owing to new technology employed in biomarker discovery.
Tumor markers can be used for risk stratification, screening, differential diagnosis, prognosis, predicting, and monitoring response to therapy and detecting recurrence (Table 5.1). The performance of a tumor marker depends on its sensitivity (percentage of patients with cancer correctly identified as a result of a positive test), specificity (percentage of the population without cancer correctly identified as a result of a negative test), and positive predictive value (PPV, percentage of patients with positive test that have the cancer, true positives) (Table 5.2). An ideal tumor marker should have a 100% sensitivity, specificity, and PPV. However, in practice such a marker does not exist. As the majority of markers are tumor-associated rather than tumor-specific, and are elevated in multiple cancers, benign and physiologic conditions, they lack specificity. In addition, if sensitivity is low, a normal result may not exclude malignancy. Tumor markers discovered thus far contribute to differential diagnosis but are not themselves diagnostic. This restricts their use, with few exceptions, to monitoring therapeutic response and follow-up. Tumor markers currently used in nongynecologic malignancies include:
1. Carcinoembryonic Antigen (CEA), the most commonly elevated marker in colorectal cancer, whose preoperative assessment is recommended by the American Society of Clinical Oncology (ASCO) as it may complement surgical staging and help in choosing the most appropriate surgical treatment. Abnormal preoperative levels may also indicate higher risk of recurrence but there is no concrete evidence as to whether patients with colorectal cancer would benefit from adjuvant therapy based on preoperative CEA alone (1). CEA is, however, not used in screening or early diagnosis.
2. CA-15-3, measurements of which have been advocated (ASCO) in monitoring response to treatment in breast cancer when the disease is not measurable.
3. Prostate-specific antigen (PSA) is used in screening for prostate cancer but its use as a stand-alone marker is not recommended. Most guidelines recommend a PSA test followed by digital rectal examination with definitive diagnosis always requiring a biopsy. PSA may have a role in detecting disease recurrence and monitoring treatment in patients with prostate cancer (2).
Tumor Markers and Their Potential Uses |
1. Risk stratification
Adjusting risk categorization for an individual without the disease. The marker could then be used in screening or prevention if these are proven to be effective
2. Screening
Screening to detect cancer earlier than it would have been using clinical signs and symptoms
3. Differential diagnosis
Use of serum and tissue tumor markers to establish the tissue of origin of a newly diagnosed cancer by differentiating between the cancer and benign conditions
4. Prognosis
Markers used to determine prognosis in a patient, i.e., risk of invasion and metastasis in the absence of therapy
5. Prediction
Ability of a marker to determine the likelihood of sensitivity or resistance to specific therapy
6. Monitoring
Monitoring patients either during or after therapy to determine the status of the cancer. Patients are usually monitored during primary therapy but also during therapy for metastatic disease to determine if the patient is responding to the treatment of if an alternative therapy is needed
Parameters of Tumor Marker Assays |
| True Tumor Status | |
Tumor Marker Result | Positive | Negative |
Positive | A | B |
| (True positives) | (False positives) |
Negative | C | D |
| (False negatives) | (True negatives) |
Sensitivity = True positives / All with tumor = A / A + C
Specificity = True negatives / All tumor free = D / D + B
Positive predictive value (PPV) = True positives/All with positive tumor-marker result = A / A + B
This chapter focuses on those markers that are clinically relevant to female genital tract malignancies.
OVARIAN AND FALLOPIAN TUBE CANCERS
Women have approximately a 1% to 2% lifetime risk of developing ovarian cancer (OC) and it accounts for 4% of cancers diagnosed in women, with over 225,000 new cases diagnosed worldwide each year (3). Incidence rates are highest in the U.S. and Northern Europe and lowest in Africa and Asia. It is associated with the highest mortality rates of all female genital tract malignancies. Around 85% of cases occur over the age of 50, and 80% to 85% of cancers are epithelial in origin. Epithelial ovarian cancer (EOC) may be serous, mucinous, endometrioid, clear cell, transitional, and undifferentiated. The most common histologic subtype of EOC is serous OC, which usually presents at advanced stages and has the poorest outcomes (4). However, in the reproductive age group germ cell tumors, granulosa cell/sex-cord tumors, mucinous, and endometrioid tumors are more common. Only a few tumor markers have been validated for clinical use with the best known among them being cancer antigen 125 (CA-125).
CA-125
CA-125 was first described by Bast et al. in 1981. It is a 200-kDa glycoprotein recognized by the OC-125 murine monoclonal antibody (5). CA-125 carries two major antigenic domains: domain A (binds monoclonal antibody OC-125) and domain B (binds monoclonal antibody M11) (6). The current second-generation heterologous CA-125-II assay incorporates M11 and OC125 antibodies, while the original homologous assay was with OC125 alone. Currently there are a number of CA-125 assays that correlate well with each other (7,8).
CA-125 is expressed by amniotic and coelomic epithelium during fetal development. It is widely distributed in adult tissues (mesothelial cells of the pleura, pericardium and peritoneum, tubal, endometrial and endocervical epithelium) but is not expressed by the surface epithelium of normal fetal and adult ovaries with the exception of inclusion cysts, areas of metaplasia, and papillary excrescences (9). It therefore lacks complete specificity for OC.
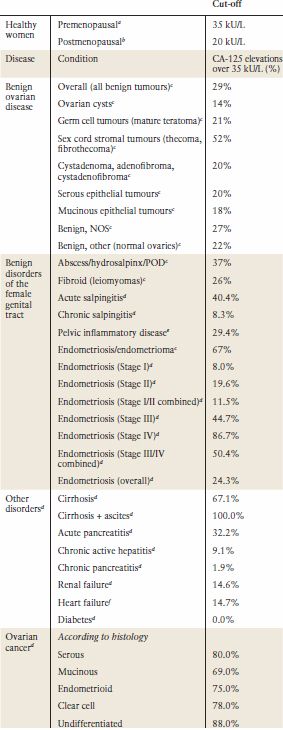
The level of CA-125 in body fluids or ovarian cysts does not correlate well with serum levels. This is probably due to the serum concentration being reflective not only of the production of the antigen by the tumor but other factors that affect its release into the circulation. The widely adopted cut-off at 35 kU/L routinely used in clinical practice is based upon the distribution of values in 99% of 888 healthy men and women (10). However, levels of CA-125 tend to be lower in postmenopausal women or in patients who have undergone hysterectomy; levels of 20 U/mL and 26 U/mL have been suggested (11–13). Approximately 85% of patients with epithelial ovarian cancer have CA-125 levels of greater than 35 U/mL (10,14). Raised serum levels are found in 50% Stage I and greater than 90% Stage II-IV cancer (15) (Table 5.3). CA-125 levels are more frequently elevated in serous compared to mucinous, clear cell, and borderline tumors (15–17). CA-125 can be elevated in other malignancies (pancreas, breast, colon, and lung cancer) (Table 5.4) and in benign conditions (Table 5.3) and in physiologic states such as pregnancy, endometriosis, and menstruation (15). Diagnostic accuracy of raised CA-125 in postmenopausal women is improved by absence of many of these nonmalignant conditions (Table 5.3).
CA-125 Elevations in Benign Disorders and Ovarian Cancer |
aBast RC Jr, et al. A radioimmunoassay using a monoclonal antibody to monitor the course of epithelial ovarian cancer. N Engl J Med 1983;309(15):883–887.
bBon GG, et al. Serum tumor marker immunoassays in gynecologic oncology: establishment of reference values. Am J Obstet Gynecol 1996;174(1 Pt 1): 107–114.
cMoore et al. Comparison of HE4 and CA125 levels in benign gynaecological disease. Am J Obstet Gynecol 2012.
dJacobs I, Bast RC Jr, The CA 125 tumour-associated antigen: a review of the literature. Human Reprod 1989;4(1):1–12.
eMuyldermans M, Cornillie FJ, Koninckx PR. CA125 and endometriosis. Human Reprod Update 1995;1(2):173–187.
fMiralles C, et al. Cancer antigen 125 associated with multiple benign and malignant pathologies. Ann Surg Oncol 2003;10(2):150–154.
Screening
Screening is the identification of unrecognized disease in apparently asymptomatic population by use of tests, examinations, or other procedures that allow earlier diagnosis of the disease than if it had presented clinically. The main goal of cancer screening is to reduce mortality from the disease by either preventing it (if a premalignant condition exists) or diagnosing it earlier when treatment is more effective. Just detection of the cancer of interest before it is symptomatic cannot justify screening.
There are cancer-specific criteria detailing which cancers could most benefit from screening which build on the WHO criteria for all diseases (Table 5.5) (18). To be effective and applicable to the population at large, screening needs to achieve high sensitivity/specificity, PPV, and negative predictive value (NPV) (Table 5.6), and be acceptable to the populations to be tested. The PPV depends on the prevalence of the disease within the population, with more false positives detected if disease prevalence is low. Well-organized national screening programs, such as for cervical screening, are required to realize the true potential of screening in reducing disease-specific mortality.
In a national screening program, issues that have to be considered include frequency of screening, age of the population to be screened, well-defined mechanisms for referral and treatment of screen-detected abnormalities, comprehensive information systems that not only send invitations at predefined intervals but also recall those with abnormalities for assessment and schedule follow-up of those treated, and quality assurance protocols to monitor and evaluate the efficacy of the screening program. Furthermore, for a screening strategy to be successful, uptake and compliance with screening has to be high.
CA-125 Elevations in Nonovarian Malignancies |
| Cancer | CA-125 elevations over 35 k U/L (%) |
Nongynecologic malignancies | Breasta | 17.6% |
| Colorectala | 15.1% |
| Pancreasa | 52.6% |
| Lunga | 29.5% |
| Gastrica | 30.9% |
| Biliary tracta | 45.8% |
| Livera | 49.0% |
| Oesophageala | 10.5% |
Nonovarian gynecologic malignancies | 21% | |
| Endometrial cancerd | 25% |
| Stage III | 55% |
| Stage IV | 86% |
| Cervical cancere | 30% |
aJacobs I, Bast RC Jr. The CA 125 tumour-associated antigen: a review of the literature. Human Reprod 1989;4(1):1–12.
bGinath S, et al. Tissue and serum CA125 expression in endometrial cancer. Int J Gynecol Cancer 2002;12(4): 372–375.
cDuk JM, et al. CA 125: a useful marker in endometrial carcinoma. Am J Obstet Gynecol 1986;155(5):1097–1102.
dBonfrer JM, et al. Clinical evaluation of the Byk LIA-mat CA125 II assay: discussion of a reference value. Clin Chem 1997;43(3):491–497.
eGupta D, et al. Performance of serum CA125 as a prognostic biomarker in patients with uterine papillary serous carcinoma. Int J Gynecol Ca 2011;21(3):529–534.
The first cancer screening program to be implemented was for cervical cancer in 1940. However, its impact on mortality has only been evident since the introduction of organized screening programs. Breast cancer screening began in the 1960s when mammography became available. The initial study of 62,000 women aged between 40 to 64 years lasted over 25 years and provided the first experimental evidence of the efficacy of the breast cancer screening strategy (19). In the 1970s, lung cancer screening trials using chest radiograph and sputum cytology were initiated, followed by the first colorectal cancer screening trial in 1975. Trials of prostate and ovarian cancer screening started in the 1990s (20).
World Health Organization Criteria for a Screening Program |
1. The condition sought should be an important health problem
2. There should be accepted treatment for patients with recognized disease
3. Facilities for diagnosis and treatment should be available
4. There should be a recognizable latent or early symptomatic stage
5. There should be a suitable test or examination
6. The test should be acceptable to the population
7. The natural history of the condition, including development from latent to declared disease, should be adequately understood
8. There should be an agreed policy on whom to treat as patients
9. The cost of case finding (including diagnosis and treatment of patients diagnosed) should be economically balanced in relation to possible expenditure on medical care as a whole
10. Case finding should be a continuing process and not a “once and for all” project
Source: From Wilson J, Jungner G. WHO principles and practice of screening for disease. Geneva: World Health Organization, 1968:66–67 (5).
Parameters Crucial when Evaluating Screening Tests |
1. Test validity
Accuracy/Validity of the screening test is evaluated by sensitivity and specificity of the screening test. Sensitivity is the correct identification of the individuals with disease out of all with positive screening results, whereas specificity is the proportion of people with negative screening test who do not have the disease
2. Measuring test performance
Easier to measure in research setting than in a screening program. The proportion of the population with detectable preclinical disease is an important factor judging the effectiveness of a screening strategy. An ideal test would detect the disease early; those that can only detect advanced disease indicate a long screening interval or poor sensitivity of the test
3. Positive Predictive Value (PPV)
Proportion of individuals with a positive screening test that will have the disease. A PPV of 10% means that only one out of ten individuals investigated had the disease, the other nine were investigated unnecessarily
4. Negative Predictive Value (NPV)
Proportion of individuals with a negative test result who are correctly diagnosed as not having the disease. In clinical setting, high NPV means that the test only rarely misclassifies a sick person as being healthy
5. Test sensitivity versus program sensitivity
Test sensitivity (screening test applied once) can be different from program sensitivity (screening test applied multiple times to the same population). Program sensitivity is higher in cases where population adherence to screening is high, because if the cancer was missed in the first round of screening, it is very likely it would be picked up on the second round. However, if adherence with screening is poor, there will be cancers that will be missed and diagnosed only when symptomatic
6. Validity
RCTs are the gold standard for evaluating effectiveness of a screening strategy but need a large number of participants and take a long time to complete (at least 15 years). Case-control studies have been used to evaluate screening tests but suffer due to potential selection bias
7. Lead time bias
Screening advances the time of diagnosis, therefore the duration of time between when a cancer is detected by screening and when it would have been detected due to symptoms is referred to as lead-time. However, if there is no effect on survival, i.e., the cancer is diagnosed through screening, but the individual dies at the same time as if detected by symptoms, it would falsely appear that the survival is longer in the screened population when it is not. This is called lead-time bias
8. Length-bias sampling
Screening tends to pick up less aggressive, slow-growing cancers and less likely to pick up more aggressive, faster-growing cancers. Length-time bias refers to the greater likelihood of screen-detected cancers to be slow-growing—this would give the false impression of improved survival of screen detected cancers
9. Overdiagnosis
Screening can result in overdiagnosis, detection of the cancer that would not have been detected during that person’s lifetime if it were not for screening. These lesions are not easy to distinguish from those that become clinically significant. There may be serious consequences for these patients. However, overdiagnosis probably contributes a small percentage of harm compared to the benefits of screening
10. Selection bias
Individuals who participate in screening programs are usually more health conscious, healthier, more aware of signs and symptoms of the disease, have better access to treatment, and are more likely to adhere to treatment. Hence, they might have better outcomes if they develop cancer than the unscreened population. Selection bias is higher in clinical trials than in screening programmes that are associated with high uptake
Screening can also contribute to primary prevention, as in colorectal cancer screening, where removal of adenomas substantially reduces the incidence of colorectal cancer. However, there are downsides to screening too. Breast cancer screening has had a lot of criticism in recent years as it picks up less aggressive forms of the disease, ductal carcinoma in situ (DCIS) that would have otherwise gone unnoticed during an individual’s lifetime. Compliance with colorectal cancer screening is an issue probably due to the nature of the test. Prostate screening has been hampered by low sensitivity of the PSA test when used alone.
Screening for ovarian cancer continues to be investigated in the research setting with CA-125 the only tumor marker currently being explored in large trials. When it is interpreted using a cut-off, 2.9% of healthy postmenopausal women will have elevated CA-125 levels, limiting its use as a stand-alone test (21). In the multimodal screening strategy, this is overcome by use of transvaginal ultrasound (TVS) as a second-line test in women with elevated CA-125 levels so that high specificity (99.9%) and four or less operations for each OC detected can be achieved (22,23). Ovarian morphology has been used to refine algorithms for interpreting TVS in postmenopausal women with elevated CA-125 (24,25). Over the last decade, CA-125 interpretation in the context of screening has been further improved by a more sophisticated approach incorporating age, menopausal status, and the rate of change of CA-125 values over time (26–28). This statistical algorithm (Risk of Ovarian Cancer, ROC), based on the age-specific risk of the disease and the behavior of CA-125 with time in women with ovarian cancer versus normal controls, has improved both the sensitivity and specificity of CA-125 interpretation (28). Prospective evaluation of the ROC algorithm in a randomized controlled trial (RCT) of 13,582 postmenopausal women aged over 50 demonstrated high specificity (99.8%; 95% CI, 99.7–99.9) and PPV (19%; 95% CI, 4.1–45.6) for primary invasive EOC (26). Algorithms, such as the ROC, rely on modeling the behavior of a biomarker from disease onset to clinical presentation and use data that may take years to accumulate.
Four large trials on OC screening (OCS) have reported in the past decade. The Kentucky Screening Study (29), a single-arm annual ultrasound screening study of 25,327 women, reported a sensitivity for primary epithelial ovarian cancer of 81% with 9.3 operations carried out per case detected. For primary invasive OC, sensitivity decreased to 76.3%. Encouragingly, the majority of the primary ovarian cancers (82%) were early stage (I/II). Recently, the study reported that at a mean follow-up of 5.8 years, the women in the trial (primary invasive OCs, screen positives and interval cancers) had a longer 5-year survival (74.8% ± 6.6%) compared to the women from the same institution treated by the same surgical and chemotherapeutic protocols that were not screened (53.7% ± 2.3%) (p < 0.001). Moreover, 70% of the screen-detected OCs were at early stage (I/II) (30), but this was not a RCT and there may be a range of factors responsible for the apparent impact of screening.
The Japanese Shizuoka Cohort Study of Ovarian Cancer Screening (31) was an RCT of 82,487 low-risk postmenopausal women who were screened using an annual ultrasound and CA-125 using a cut-off. Sensitivity of 77.1% and specificity of 99.9% was reported for this trial with OC detection rates of 0.31 per 1000 women at prevalent screen and 0.38–0.74 per 1000 women at subsequent screens. Proportion of stage I OC was higher in the screened group (63%) than in the control group (38%) but did not reach statistical significance (31). The effect on mortality has not yet been reported.
The U.S. Prostate, Lung, Colorectal and Ovarian (PLCO) Cancer Screening Trial enrolled 78,237 women aged 55 to 74 years, with 34,202 women randomized to OCS. Women were screened using serum CA-125, using a cut-off of 35 kU/L, and transvaginal ultrasonography for 3 years followed by CA-125 alone for a further 2 years. Evaluation and management of positive screening tests was at the discretion of participants’ clinicians. Women were followed up for a median of 12.4 years (25th to 75th centile, 10.9–13.0) (32). During the prevalence screen in 28,816 women, 29 ovarian, tubal, and peritoneal cancers were detected, of which 20 were invasive, and nine were borderline. A total of 4.7% women had an abnormal scan and 1.4% an abnormal CA-125. The PPV for invasive cancer was 3.7% for abnormal CA-125, 1% for abnormal transvaginal scanning and 23.5% if both tests were abnormal (33). The results of the first 4 rounds of screening in 34,261 postmenopausal women reported 89 invasive ovarian/peritoneal cancers, of which 60 were screen detected. Only 28% of screen-detected cases were stage I/II. The overall ratio of surgeries per screen-detected cancers was 19.5:1, having decreased over the years from 34% in the first year of screening to 15% to 20% in subsequent years (34).
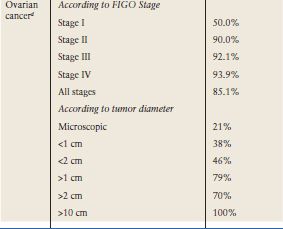
In The UK Collaborative Trial of Ovarian Cancer Screening (UKCTOCS), 202,638 postmenopausal women aged between 50 and 74 years were randomized to either control or annual screening with ultrasound or a multimodal strategy in a 2:1:1 fashion (35,36) (www.ukctocs.org.uk) (Fig. 5.1). In the multimodal group, CA-125 is interpreted using the ROC algorithm (that takes into account the absolute value of CA-125 and serial levels over time) to triage the women into low, intermediate, and elevated risk. Those at intermediate risk have a repeat CA-125 in 12 weeks, whereas those with elevated risk are referred for a transvaginal scan and repeat CA-125 in 6 weeks. In addition to assessing the effect of ovarian cancer on mortality, the trial will also address acceptability, compliance, costs, performance characteristics of the 2 screening strategies, and the physical and psychological morbidity of screening. The prevalence screen suggests that multimodal strategy has superior sensitivity (89.4%) and specificity (99.8%) to ultrasound screening alone (sensitivity 84.9%; specificity 98.2%) for primary ovarian cancer. For primary invasive ovarian cancers, the sensitivity of multimodal screening remained at 89%, whereas that of the ultrasound-based strategy decreased to 75.0% (36). Results are expected in 2015.
Currently, there is lack of evidence whether screen-detected cancers include a significantly high proportion of high-grade serous carcinomas in early stage or only those subtypes that confer better prognosis.
Although it has been shown that screening can detect ovarian cancer early (31) and provide a survival benefit in the screened group, only two randomized trials have so far reported on the impact of OCS on survival or mortality. The first one, involving 22,000 women carried out in the 1980s, which used sequential CA-125 and Transvaginal scanning (TVS), reported improved survival of 72.9 months in the screened versus 41.8 months in the control group (22). Recently, the PLCO trial (32) reported no mortality benefit with OCS with 118 and 100 deaths in the screening and control arm, respectively (mortality rate ratio of 1.18 (95% CI, 0.91–1.54) (Fig. 5.2). These data did not demonstrate a mortality benefit from simultaneous screening with CA-125 (using an absolute cut-off) and TVS scanning. Moreover, excess morbidity of carrying out surgery in women with false-positive results was 5.1% (32). However, the mortality data from PLCO needs to be interpreted with caution as concerns have been raised about the trial design, as 40.6% of women were diagnosed after screening ended, CA-125 was interpreted using an absolute cut-off (rather than a time series algorithm), and management of screen positives was at the discretion of the treating clinician (rather than via a well-defined protocol) (37). UKCTOCS, the largest OCS trial (38), will report in 2015, and should address some of these issues. On the basis of current evidence, women from the general population should only be screened in the context of research trials.
Women who have a strong family history of ovarian cancer constitute only 5% to 10% of women with ovarian cancer. These women (from families with multiple first-degree relatives affected by breast and ovarian cancer, or Lynch syndrome) have a greater than 10% lifetime risk of developing ovarian cancer, and are considered to be high-risk. Most of this risk is attributable to mutations in the BRCA1, BRCA2, and MMR genes with cumulative risks by the age of 70 years for ovarian cancer of 40% (35% to 46%) in BRCA1-mutation carriers, 18% (13% to 23%) in BRCA2 mutation carriers (39), and 10% to 12% in women with mutations in the MMR genes (40). These women often seek screening, but the current recommendation is that they should consider risk-reducing bilateral salpingo-oophorectomy once they have completed their families.
There are a number of studies evaluating OC screening in the familial context (41,42). There is some evidence that a strategy based on annual screening is not effective in detecting early stage disease in this population. An approach based on 3 to 4 monthly screening is currently being evaluated in the UK Familial Ovarian Cancer Screening Study (UKFOCSS, prospective screening study based on annual TVS and CA-125 interpreted using the ROC algorithm, with over 5700 women) (43) and trials are under way under the auspices of the Cancer Genetics Network and Gynecological Oncology Group (44). Both trials are using the ROC algorithm with a screening interval of 3 to 4 months. One of the trials in the high-risk group has reported so far; the U.S.-based Cancer Genetics Network (CGN) (45) used the ROC algorithm to screen 2,343 high-risk women at 3 monthly intervals. Thirty-eight women underwent surgery following 6,284 screens; 5 ovarian cancers were detected, of which 2 were prevalent (1 early, 1 late stage) and 3 were incident (all early) cases resulting in a PPV of 13%. Three further occult cancers were detected at risk-reducing salpingo-oophorectomy and 1 woman developed an interval (late stage) cancer (46). The results of the UK trial are anticipated in 2013.
There are some recent developments with immediate implications for OC screening. These include novel insights into tumor biology, as reflected in the proposed classification of OCs into Type I, slow growing cancers with good prognosis such as low-grade serous, low-grade endometrioid, clear cell, mucinous, and transitional (Brenner) carcinomas, and more aggressive Type II, which include high-grade serous, high-grade endometrioid, undifferentiated tumors and carcinosarcomas (47). Screening strategies including biomarker discovery and refining of ultrasound indices need to take into account both types with a focus on detection of type II cancers, which account for over 80% of OC mortality. To date, the goal of screening was limited to detection of early-stage disease (48,49) but the work of Crum et al. supports a model of “fimbrial-ovarian” serous neoplasia, with a proportion of serous OCs starting as premalignant serous tubal intraepithelial cancer (STIC) lesions in the distal fallopian tube and spreading to the ovary (50). This raises the possibility of primary prevention in the future.
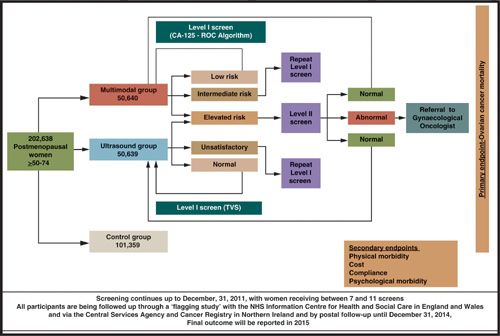
FIGURE 5.1. The United Kingdom Collaborative Trial of Ovarian Cancer Screening (UKCTOCS). Women in the trial, based on the risk of ovarian cancer (ROC) value, are triaged into low risk (ROC, <1 / 3,500), and returned to annual screening with the next blood test in one year; intermediate risk (<1 / 1,000 and <1 / 3,500) with a repeat CA-125 in 12 weeks; and elevated risk (>1 / 1,000) with Level II screen (CA-125 and TVS) scheduled in 6–8 weeks, with earlier screens arranged where there was a high index of suspicion. Those with persistent abnormalities on Level II screen are referred to a gynecologic oncologist. The screening protocol has been described in detail elsewhere. Roc, risk of ovarian cancer; TVS, transvaginal ultrasound.
FIGURE 5.2 Prostate Lung Colorectal and Ovarian (PLCO) Cancer Screening Trial. Women in the trial underwent 4 annual screens with CA-125 (interpreted using a cut-off of 35 kU/L) and TVS and 2 further screens with CA-125 alone. If an abnormality was detected on screening, the women underwent referral to their physician. Final outcome (OC mortality) was reported in 2011. TVS, transvaginal ultrasound.
In a 1980s biobank study, CA-125 was found to be raised in 59 out of 236 (25%) stored serum samples collected from women with ovarian cancer 5 years before diagnosis (13). Data from a Japanese OCS study indicate that, in serous-type ovarian cancer, first elevation of CA-125 to diagnosis has a shorter interval compared with those with nonserous-type disease (1.4 vs. 3.8 years; p = 0.011). Although 47% of nonserous-type ovarian cancers developed from slightly elevated CA-125 levels between 35 and 65 kU/L, 75% of serous ovarian cancers developed suddenly from a normal CA-125 level (<35 kU/L) (51). A model of natural history of OC developed by Brown and Palmer suggests that on average, it takes over 4 years for in situ, stage I or stage II cancers to become clinically apparent, and approximately 1 year for stage III/IV cancers (52). Serous cancers are less than 1 cm in diameter during the occult period. The model suggests that for a screening strategy to be able to detect 50% of the cancers before they progress to stage III, an annual screen would have to detect tumors 1.3 cm in diameter (53). Unpublished data from UKCTOCS suggest that detecting such small high-grade serous cancers may be feasible using the ROC algorithm.
Recently, using samples from 112 OC patients and 706 controls from PLCO, Urban et al. demonstrated that Human Epididymis protein 4 (HE4) had higher sensitivity of confirming Type II cancers (40% vs 20%) than Type I cancers (18.8% vs 56.2%) compared to TVS. HE4 had higher sensitivity (35.7%) than TVS (28.6%) as a first-line test. The sensitivity of HE4 was improved by using TVS as a second-line test. Combination of HE4 and CA-125 (32.1%) had a better sensitivity than TVS alone (20.2%). However, the authors stress that diagnosing HE4-associated tumors is not necessarily better than diagnosing TVS-associated tumors in terms of outcome (54).
Whether a raised CA-125 in asymptomatic postmenopausal women is a predictor of nongynecologic cancer is not yet clear. Data from the RCT of 22,000 postmenopausal women (22) reported that elevated serum CA-125 was not a predictor of a nongynecologic malignancy on mean follow-up of 2,269 days (55). However, it was associated with significantly increased risk of death from all causes in the next 5 years (56). In contrast, data from the Norwegian OCS trial of 5,500 women showed that breast and lung cancer were overrepresented among women with elevated CA-125 (57). Both trials indicate that elevated CA-125 is a risk factor for death from malignant disease. These data indicate that steps should be taken to rule out other malignancies such as breast, lung, and pancreas in asymptomatic postmenopausal women with rising CA-125 levels with no evidence of gynecologic malignancy.
One of the limitations of CA-125 is that 15% to 20% of ovarian cancers do not express the antigen. This may partly be caused by CA-125 forming circulating immune antibodies containing complexes bound to the free antigen (58). Rosen et al. (59) explored 10 potential serum markers that could complement CA-125 in 65 ovarian cancers with weak or absent CA-125 tissue expression. All specimen lacking CA-125 expressed human kallikrein 10 (HK10), human kallikrein 6 (HK6), osteopontin, and claudin 3. A small proportion of CA-125 negative ovarian cancers expressed DF3 (95%), vascular endothelial growth factor (VEGF) (81%), MUC1 (62%), mesothelin (MES) (34%), HE4 (32%), and CA-19-9 (29%). MES and HE4 showed the greatest specificity when reactivity with normal tissues was considered. Differential expression was also found for HK10, osteopontin, DF3, and MUC1 (59). Several of these markers are currently being assessed in nested case control studies using serum samples from ovarian cancer screening trials.
The screening trials in the general population have focused on postmenopausal women as around 90% of ovarian cancers are sporadic and occur in women from the general population over the age of 50. A number of risk factors affect ovarian cancer risk in the general population, such as oral contraceptive use, parity, and hysterectomy, which can be used to determine an individual’s risk. Recent efforts have focused on identification of low- and moderate-penetrance genes that predispose women to ovarian cancer (60–63). It is therefore very likely that population-screening strategies in the future will use a risk-stratification tool that combines these factors.
Additional Markers
In the past few years, major efforts have been made to identify either a better marker or a panel of markers that would improve the performance of CA-125 in the context of screening. However, most of the studies used clinical samples (rather than preclinical samples), so their findings are more relevant to differential diagnosis of benign from malignant masses, avoiding unnecessary operations in women with benign lesions and ensuring that surgery, where there is high suspicion of ovarian cancer, is undertaken by trained gynecologic oncologists in tertiary-care centers (64–66). Using a CA-125 cut-off of 35 kU/L combined with imaging has been shown to achieve a sensitivity of 94% and specificity of 90% for differential diagnosis of ovarian cancer from benign disease (67). The performance of various other markers to detect ovarian cancer has been evaluated: Interleukin-6 (IL-6), Interleukin-7 (IL-7), soluble Interleukin-2 receptor (sIL-2R), Tumor Necrosis Factor (TNF), Soluble receptors of TNF (sTNF-R), Macrophage Colony-Stimulating Factor (M-CSF), CA-15-3, CA-72-4 or TAG-72, CA-19-9, OVX1, CASA/OSA, Growth factors, Tetranectin, Tumor-Associated Trypsin Inhibitor (TATI), GAT (Galactosyltransferase associated with tumor), LASA (lipid-associated sialic acid), VEGF (vascular endothelial growth factor), IAP (immunosuppressive acid protein), Lysophosphatidic Acid (LPA), Prostasin, Cadherin, Shed glycans, Dipeptase 1; however, despite a plethora of studies, none been shown to be useful in clinical practice. Limited sensitivities and specificities constrain their use in screening.
The only promising marker in the last decade has been serum human epididymis protein 4 (HE4). Preclinical samples from asymptomatic women from the PLCO trial were used to assess the performance of 49 ovarian cancer biomarkers using the ProBE design (68) of a prospective-specimen collection, with retrospective-blinded evaluation study design (69). The performance of “standard” tumor markers, such as CA-125, HE4, CA-72.4, and CA-15.3, in prediagnostic samples drawn within 6 months of cancer diagnosis was comparable to that in clinical samples. Performance was poorer for markers such as prolactin, transthyretin, or apolipoprotein A1, which may reflect the individual response to the cancer, in prediagnostic specimens. Serum CA-125 remained the single best biomarker for ovarian cancer, with sensitivity of 86% (95% CI, 0.76–0.97) in cases where blood was drawn within 6 months of diagnosis, with the second best marker being HE4, with sensitivity of 73% (95% CI, 0.60–0.86). For all markers, sensitivity declined in specimens more remote than 6 months from diagnosis. However, the limitation of this study was that CA-125 was used in “real time” for triaging women for diagnostic work up for ovarian cancer (70). A recent study by Anderson et al. (71) using specimens from the Carotene and Retinol Efficacy Trial showed that a panel including CA-125, HE4; mesothelin may provide signal for ovarian cancer 3 years before diagnosis; this is consistent with data from the UK screening trials.
Another recent study using a nested case-control design in laboratory-blinded samples obtained before cancer diagnosis and matched controls from the (PLCO) Cancer Screening Trial demonstrated that none of the 5 predictive models, each containing 6 to 8 biomarkers, nor a model derived from all of the 28 markers evaluated, showed improvement over CA-125 alone (72). There are 2 possibilities why studies have failed to show improvement over CA-125; either the current technologies are unable to identify biomarkers with greater or complementary potential for screening, or the available technologies, powerful as they are, have not yet been applied appropriately either in discovery or in validation, with one of the main obstacles being use of clinical as opposed to prediagnostic/preclinical samples (69).
A limited number of studies have investigated the utility of proteomic markers in preclinical diagnosis of ovarian cancer. The most recent study of preclinical samples from 118 OC cases and 951 age-matched controls from the PLCO trial collected less than 12 months before cancer diagnosis showed that although CA-125 was elevated in 61.5% of the 65 OC cases that had CA-125 data available, a combination of CA-125 and apolipoprotein A1, truncated transthyretin, transferrin, hepcidin, β2 microglobulin, connective tissue activating protein III, and interalpha-trypsin inhibitor heavy-chain 4 did not improve sensitivity of using CA-125 alone (73).
To ascertain the optimal biomarker panel to distinguish early-stage OC from healthy women, Yurgovetsky et al. had used multiple xMAP bead-based immunoassays using 96 serum biomarkers and applied it to samples from 139 patients with early-stage ovarian cancer, 149 patients with late-stage ovarian cancer, and 1,102 healthy women. The highest sensitivity (86%) and specificity (98%) was achieved using a 4-marker panel consisting of CA-125, HE4, CEA, and VCAM-1. In an independent blinded validation set (44 patients with early-stage ovarian cancer, 124 patients with late-stage ovarian cancer, and 929 healthy women), sensitivity for early stage (I/II) disease remained at 86% but increased to 95% for late stage disease (III/IV) while maintaining high specificity (98%) (74). This panel justifies evaluation in a screening context.
Although limited progress has been made in identifying new biomarkers, it is likely that novel algorithms that incorporate serial change over time of some of these markers alongside CA-125 may significantly improve screening performance.
Differential Diagnosis of an Adnexal Mass
The factors that influence whether a tumor marker is incorporated into clinical practice are outlined in Table 5.7. Serum CA-125 is of value in differential diagnosis of benign and malignant adnexal masses, especially in postmenopausal women. Using an upper limit of 35 U/mL, sensitivity of 78%, specificity of 95%, and PPV of 82% were achieved for malignant disease in women with palpable adnexal masses (75). This has since been confirmed by numerous studies (76–78). Further improvements in specificity were achieved by using a panel of markers (CA-125 II, CA-72-4, CA-15-3, and LASA) and an artificial neural network approach to differentiate malignant from benign pelvic masses (79).
The Risk of Malignancy Index (RMI) has been the most valuable clinical tool used in the past two decades. It combines serum CA-125 values with ultrasound findings and menopausal status. The initial study demonstrated a sensitivity of 85% and a specificity of 97%. Patients with an elevated RMI score had on average a 42-fold increase in the background risk of ovarian cancer (80).
Criteria for Incorporating Tumor Marker into Clinical Practice |
1. The intended use of the tumor marker must be clearly outlined
2. The difference between ‘positive’ and ‘negative’ populations must be sufficient to guide change in clinical management
3. The estimate of difference must be reliable and validated
Assay must be technically stable, reproducible and accurate
Clinical study must have been suitably designed and have a sufficient power to address the utility of intended use
Statistically analysis must be rigorous
Source: Hayes D.F. (2011). Biomarkers. In V.T. DeVita Jr, T.S. Lawrence, S.A. Rosenberg, R.A DePinho, R.A. Weinberg (Eds), Cancer: Principles and Practice of Oncology. (pp. 694–701). Wolters Kluwer Health; Lippincott, Williams & Wilkins.
Since then, the RMI has been validated extensively. A systematic review of 109 eligible studies assessing accuracy of models for predicting malignancy in ovarian masses showed that while all models had acceptable sensitivity and specificity, RMI was the best predictor. Using 200 as the cut-off, the pooled estimate for sensitivity for preoperative assessment of an adnexal mass was 78% for a specificity of 87% (81). Varying the RMI cut-off (25 to 1,000) in combination with specialist ultrasound (US), magnetic resonance imaging (MRI), and radioimmunoscintigraphy (RS) provided a sensitivity of 94% and a specificity of 90%, therefore suggesting this approach rather than using an RMI cut-off value of 250 alone to improve correct referral of cancer patients to a cancer center (67).
RMI over 200 has recently been evaluated in a Danish study of 1,159 women with pelvic mass referred to a tertiary center for further preoperative investigations, showing that using this cut-off, a sensitivity and specificity for ovarian cancer versus benign pelvic mass of 92% and 82%, respectively, and PPV and NPV of 62% and 97% could be achieved therefore indicating that RMI ≥200 is a reliable tool in OC diagnosis (82). RMI has also been investigated in an Asian population, in a retrospective study of 209 women undergoing surgery for adnexal mass. Using a cut-off of 200, RMI 1 gave sensitivity of 70.6%, specificity of 83.9%, PPV of 75%, and NPV of 80.6%, while RMI 2 improved sensitivity to 80% with a specificity of 78.2%, PPV of 71.6%, and NPV of 85.1%, thus favoring RMI 2 as the index better suited at predicting malignancy (83). In differential diagnosis of borderline tumors from benign adnexal masses, RMI IV (based on preoperative serum CA-125 and CA-19-9 levels, ultrasound findings and menopausal status) cut-off of 200, the Receiver Operator Characteristic area under the curves for serum CA-125, CA-19-9, ultrasound score, RMI IV(CA-125), and RMI IV(CA-19-9) were 0.580, 0.625, 0.548, 0.694, 0.734, and 0.711, respectively (84).
RMI when combined with subjective ultrasound was shown to be superior to a combination of CA-125 and HE4 and menopausal status (in the risk of ovarian malignancy assay, ROMA), in a single-center prospective cohort study of 432 women with a pelvic mass who were scheduled to have surgery (85).
Despite lower accuracy in borderline, stage I invasive, and nonepithelial ovarian cancers, the RMI is a simple, easily applicable method in the primary evaluation of patients with adnexal masses which identifies ovarian cancers more accurately than any other criterion used in diagnosis of this disease (86).
Prognosis
Preoperative serum CA-125 levels are related to tumor stage, tumor volume, and histologic grade of OC. Although initial studies did not find preoperative CA-125 to be an independent prognostic factor (87–89), it may be of value in localized/early-stage disease (90). In a study of 118 patients with FIGO stage I epithelial OC, compared to those with stage I and preoperative serum CA-125 levels <65 U/mL, stage I patients with preoperative serum CA-125 ≥ 65 U/mL had a significantly longer survival (91). This finding has been confirmed in a study of 600 patients from gynecologic cancer centers in Australia, USA, and Europe with stage I epithelial ovarian cancer. On multivariate analysis, preoperative serum CA-125 greater than 30 U/mL and age greater than 70 years at diagnosis were the only independent predictors for overall survival (OS). Levels of CA-125 of ≤30 U/mL (over histologic cell type, sub-stage and grade) were able to identify a subgroup of FIGO stage I patients with a genuinely good prognosis and survival who could possibly be spared from adjuvant chemotherapy (92). Additional parameters such as cyclooxygenase-2 overexpression in combination with preoperative CA-125 level of under 30 U/mL have been recently found to be independent predictors of survival in univariate and multivariate analyses (93). However, CA-125 does not appear to be an independent prognostic factor in advanced ovarian cancer (90).
Postoperative CA-125 levels have been found to be significant prognostic factors (87). Patients with a low CA-125 prognostic score composed of two CA-125 values, one taken preoperatively and the other taken 1 month after surgery, have significantly better prognosis than patients with high scores (94). In the immediate postoperative period, CA-125 levels can be elevated as a result of the abdominal surgery and irritation of the peritoneal cavity; therefore, measurements are best postponed for at least 4 weeks (95).
During primary chemotherapy, serum CA-125 half-life is an independent prognostic factor in patients with advanced epithelial ovarian cancer, both for complete remission and survival (96–98). The most commonly used cut-off is a CA-125 half-life of 20 days (98–100). In patients with CA-125-positive tumors, other useful prognostic indicators of survival are the serum CA-125 levels prior to third course of chemotherapy (96,101,102) and the slope of the CA-125 exponential regression curve. In patients treated on maintenance chemotherapy and achieving a clinically defined complete response to primary chemotherapy with a baseline CA-125 level of ≤35 U/mL, the baseline CA-125 level before initiation of maintenance chemotherapy strongly predicts the risk of subsequent relapse. Patients with premaintenance baseline CA-125 values ≤10 U/mL have a superior progression free survival compared to those with higher levels even if in the normal CA-125 range (103).
Serum CA-125 continues to be of prognostic significance when ovarian cancer recurs, with patients with normal serum CA-125 levels (≤35 U/mL) at relapse having a better prognosis than patients with elevated levels (104).
Apart from CA-125, other markers have been evaluated as those with prognostic value. More recently, soluble MUC1 and serum MUC1-specific antibodies have been shown to be prognostic for poor clinical response and reduced OS in both platinum-resistant as well as platinum-refractory OC treated with interleukin 2 (IL-2) (105). The mean levels of anti-MUC1 IgG was higher in patients with progressive disease, both at early (p = 0.025) and late (p = 0.052) time points during the IL-2 treatment.
Another marker, survivin, with levels higher in serous OC than in benign epithelial tumors, could not be used for differential diagnosis of OC from benign masses but could be used as a prognostic marker for OC as its levels were positively correlated with age, advanced stage, and poor disease-free survival (106).
Monitoring Response to Treatment
It is now established that serum CA-125 levels reflect progression or regression of disease in over 90% of ovarian cancer patients with elevated preoperative levels (107) (Fig. 5.1). These findings have resulted in the widespread use of serum CA-125 levels to monitor the clinical course of ovarian cancer and its response to chemotherapy (108). However, CA-125 should not be used as the sole criterion to determine clinical response (109) as studies involving second-look laparotomy have confirmed that CA-125 values of less than 35 U/mL do not exclude active disease (110). The pattern of CA-125 over time is a more useful parameter than using an arbitrary cut-off level (100,101,111,112). Precise mathematical definitions to evaluate response to treatment have been suggested with 50% response corresponding to a 50% decrease in CA-125 after 2 samples, confirmed by a third sample collected at least 28 days later and a 75% response defined as a serial decrease over 3 samples of greater than 75% (113,114). Prechemotherapy CA-125, its half-life, nadir concentration, and time to nadir have a univariate prognostic value for disease-free and OS in a multicenter French study (115).
Detecting Recurrence
Among patients with elevated CA-125 levels at diagnosis, serial monitoring following initial chemotherapy can lead to the early detection of recurrent disease. Median lead-time prior to clinical progression of 63 to 99 days has been demonstrated between marker detection of disease progression and clinically apparent progressive disease (116,117). The value of marker lead-time depends ultimately on a patient’s remaining therapeutic options, and the clinical value of this approach is unclear (118).
In a study of 39 patients with elevated serum CA-125 at time of diagnosis and complete clinical and radiographic response to initial treatment with normalization of serum, Santillan et al. reported that a relative increase in CA-125 of 100% (odds ratio [OR] = 23.7; 95% CI, 2.9–192.5) was significantly predictive of recurrence. From baseline CA-125 nadir levels, an absolute increase in CA-125 of 5 U/mL (OR = 8.4; 95% CI, 2.2–32.6) and 10 U/mL (OR = 71.2; 95% CI, 4.8 to >999.9) were also significantly associated with the likelihood of concurrent disease recurrence. These data suggest that for patients in complete clinical remission, a progressive low-level increase in serum CA-125 levels is strongly predictive of disease recurrence (119).
CA-125 measurements together with thin-section computer tomography (CT) and careful review of the clinical history have been recommended in follow-up of patients with ovarian carcinomas (120). However, a study of 58 patients with recurrent ovarian cancer revealed that 98% of recurrences were identified by physical examination and CA-125, with ultrasound and CT not providing additional clinically relevant information during follow-up (121).
In a population-based study of 331 Dutch EOC patients, van Altena et al. showed a significant association of CA-125 nadir ≤ 5 kU/L with both longer PFS and longer OS (log-rank test p < 0.01 and p = 0.03, respectively). It was also an independent prognostic variable (HR = 1.51; 95% CI, 1.04–2.31) for PFS next to histologic type, FIGO stage, and residual tumor after surgery (122). However, the MRC OVO5/EORTC55955 trial has shown no value in CA-125 monitoring in the follow-up of ovarian cancer patients. The trial included 1,442 patients with normal CA-125 level following platinum-based therapy. Patients whose levels rose to twice the upper limit of normal (529 women) were randomized to immediate (based on CA-125 levels) or delayed chemotherapy (the latter when signs and symptoms of recurrence were present). The women randomized to monitoring started chemotherapy at a median of 4.8 months earlier than those in the delayed arm but this did not result in difference in survival between the arms (early arm: median 25.7 months, 95% CI 23.0–27.9; delayed arm: median 27.1, 95% CI 22.8–30.9; HR: median 0.98, 95% CI 0.80–1.20; p = 0.85). Therefore, Rustin suggests that CA-125 should only be measured if there is a suspicion of relapse or at patient’s request (123). The pattern of CA-125 throughout a patient’s clinical course of the disease is presented in Figure 5.3.
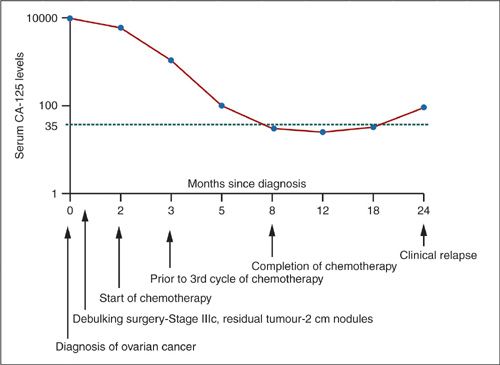
FIGURE 5.3. Correlation between serum CA-125 and clinical course in ovarian cancer.
HE4
Human epididymis protein 4 (HE4) is a glycoprotein in the epithelial cells of the epididymis. In ovarian cancer, increased serum levels and expression of the HE4 WAP four-sulphide core domain 2 (WFCD2) gene have been demonstrated (124).
Mean serum HE4 in patients with malignant ovarian lesions (248.7 pM) is much higher than in controls (34.1 pM) or women with benign lesions (39.1 pM) (Table 5.8). HE4 levels are decreased in pregnancy (median levels of 30.5 pmol/L) (125) and levels around 50 and 60 have been demonstrated in pre- and postmenopausal women, respectively (126), which increase with age (median 109.5 pmol/L in women over 80). HE4 levels are lower in many of the benign conditions that usually elevate CA-125 levels (Table 5.9), especially in women with endometriosis.
HE4 can also be elevated in other cancers (Table 5.10). Initial report stated that its specificity is superior to CA-125 (124) and of particular value for early-stage disease (127). Combining CA-125 with HE4 has been found to increase sensitivity while maintaining high specificity (127); but more recently, it has been reported not to be superior to CA-125 in clinical setting (128).
More recently, the superiority of HE4 in differential diagnosis of ovarian cancer as a single marker was reported. Moreover, the diagnostic prediction (AUC 0.864) was improved by Risk of Malignancy (ROMA) index (AUC 0.897) (129). Serum HE4 has lower sensitivity than CA-125 for early stage disease, but has better sensitivity and specificity in differential diagnosis of benign from malignant pelvic masses, especially in premenopausal patients (124). Although HE4 has recently been shown to improve the performance of CA-125 (129), in a Swedish study of 114 OC, 45 borderline and 215 patients with benign ovarian tumors, Partheen et al. showed that HE4 did not out-perform CA-125 (benign vs. malignant AUC 86.8% for CA-125 and 84.4% for HE4; benign versus Stage I OC 72% for HE4 and 76% for CA-125) (130). Very recently, Schummer et al. demonstrated that in patients who are developing a recurrence, HE4 rises earlier than CA-125 with a lead-time of up to 4.5 months (131). It can also be elevated in patients who do not express CA-125 at sufficient levels to make a clinical decision. MMP7 and Mesothelin are, however, not as useful in predicting recurrence to add to CA-125. However, as HE4 levels fail to normalize at the end of treatment, it is possible that it can be used as a marker predicting poor prognosis.
Mean Levels of Serum HE4 in Normal Controls and Benign and Malignant Lesions |
Condition | Serum HE4 level (mean) |
Normal Control | 34.1 pM |
Benign Lesions | 39.1 pM |
Malignant Lesions | 248.7 pM |
Source: Wang S, et al. The Application of HE4 in Diagnosis of Gynecological Pelvic Malignant Tumor. Clin Oncol Cancer Res. 2009; 6: 72-74.
Stay updated, free articles. Join our Telegram channel

Full access? Get Clinical Tree


