1
Children and their health
Chapter map
Children under the age of 16 comprise 20% of the population of the UK and of most industrialized countries, but in many developing countries children represent more than 50% of the population. In all countries, the management of children’s health problems is a high proportion of the medical workload. Many GPs find that 30% of their consultations are for children, particularly pre-school children (under 5 years). (Medical students in the middle of a 2- or 3-month paediatric attachment may wonder why only 5% of their training should be devoted to children!) This chapter sets the scene for your study of paediatrics, starting with an overview of child health globally and in the UK. We then review societal factors relevant to paediatrics, community and social aspects of child health, and finally the child in hospital.
1.2 Child mortality and morbidity in the UK
1.3.1 Socioeconomic inequalities
1.3.2 Changes in family structure
1.3.4 Laws relating to the young
1.3.5 Ethics and children’s rights
1.4 Child health in the community
1.4.2 Health surveillance and promotion
1.5 Social aspects of child health and care
1.1 Global child health
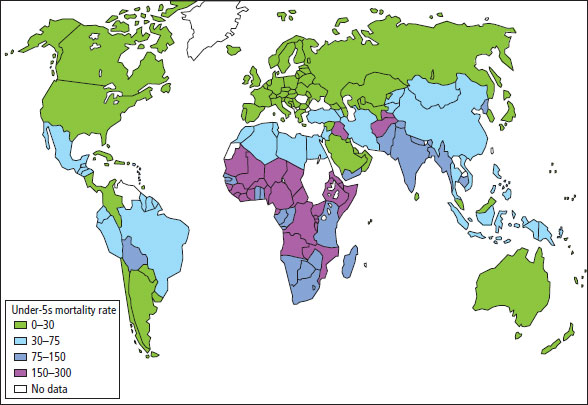
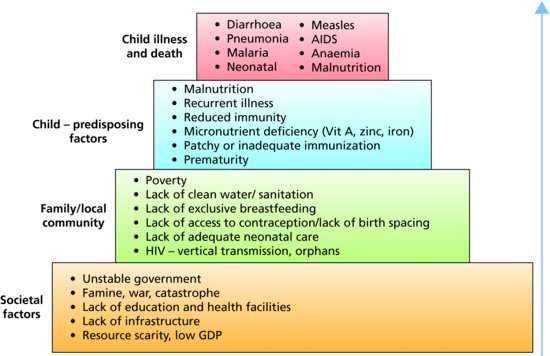
Children make up about 2 billion of the world’s population. Health inequalities between nations are seen most starkly in childhood indicators, such as under-5 mortality rates (Figure 1.1). Most childhood deaths occur in sub-Saharan Africa and south Asia (Figure 1.2), and malnutrition causes or contributes to at least half of them, along with many other factors (Figure 1.3). There has been a sustained international effort in the last few decades to address inequalities, culminating in the Millenium Development Goals adopted in 2000 by all members of the United Nations. These set measurable targets to be achieved by 2015 in relation to poverty, maternal and child health and combating disease such as HIV and malaria. Progress has been made, but much remains to be done.
Figure 1.1 Changes in worldwide under-5 mortality rates. Data taken from The State of the World’s Children 2012: Children in an Urban World (UNICEF). See www.unicef.org/sowc2012.
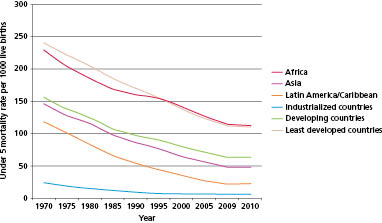
Figure 1.2 Worldwide under-5 mortality rates in year 2000. Numbers are deaths/1000 liveborn infants. There was a large reduction in under-5 mortality worldwide by about 65% from 1960 to 2000. However, from 1990 to 2000, some countries saw an increase in mortality due to HIV and armed conflicts. Reproduced with permission, courtesy of University of California Atlas of Global Inequality (http://ucatlas.ucsc.edu).
 RESOURCE
- See the United Nations Development Programme website for the latest information on progress: www.undp.org and click ‘Millenium Development Goals’.
- Health Metrics and Evaluation has a superb site to explore health and other data (www.healthmetricsandevaluation.org). Go to ‘Tools’ then ‘Visualizations’ and select ‘GBD 2010’ to review the global burden of different diseases by age and region.
- Visit www.gapminder.org for another great site to compare health and other data between countries and historically.
1.2 Child mortality and morbidity in the UK
The causes of death and the patterns of illness in children differ markedly from those in adults. They are influenced by a diversity of factors, which include sex, social class, place of birth and season of the year. The decline in child mortality in the past century has resulted more from preventative (public health) measures than from improved treatment. Today virtually the entire population of the UK has safe food and water, free immunization and easy access to local health care. This is not the case in non-industrialized countries.
In the UK, child mortality is concentrated in the perinatal period (Table 1.1). The only remaining scope for a major reduction in child deaths lies in better obstetric, neonatal and infant care.
Table 1.1 UK mortality rates
| Mortality indices | UK rate |
| Stillbirth rate (stillbirths per 1000 total births) | 5 |
| Early neonatal mortality rate (deaths in first 7 days per 1000 live births) | 3 |
| Perinatal mortality rate (stillbirths + first week deaths per 1000 total births) | 8 |
| Infant mortality rate (deaths in first year per 1000 live births) | 6 |
| Under-5 mortality rate (deaths in the first 5 years per 1000 live births) | 7 |
1.2.1 Infant mortality
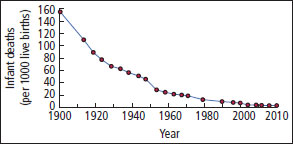
- UK infant mortality continues to fall (currently 4.3 per 1000 live births) (Figure 1.4).
- But half the countries in the European Union have lower rates.
- Several East European countries have infant mortality rates 2–3 times higher.
- Some non-industrialized countries have rates over 150.
- But half the countries in the European Union have lower rates.
- Improvement in UK infant mortality:
- Mainly due to reduction in neonatal mortality
- Less improvement in post-neonatal mortality (1 month to 1 year).
- Mainly due to reduction in neonatal mortality
- Some deaths result from persistent, serious congenital abnormalities and perinatal problems, others due to accidents or diagnosable disorders, but many are infants who die at home, for whom no cause of death is found at postmortem (Section 15.3).
Figure 1.4 Infant mortality (0–1 years). By 2010, the infant mortality in England and Wales had fallen to a fraction of the level in 1900 (from 156 per 1000 live births to 4.3 per 1000). Even in the last 30 years it has fallen by over 60%.
1.2.2 Child mortality
- The major causes of childhood death are neoplasms and accidents.
- Deaths are concentrated in early life and are higher for boys at all ages, by a factor of 1.3 in the first month of life and by 1.6 for children of school age.
- For a schoolchild, death is more likely to be due to an accident, particularly a road accident with the child as pedestrian or cyclist, than to any disease (Figure 1.5).
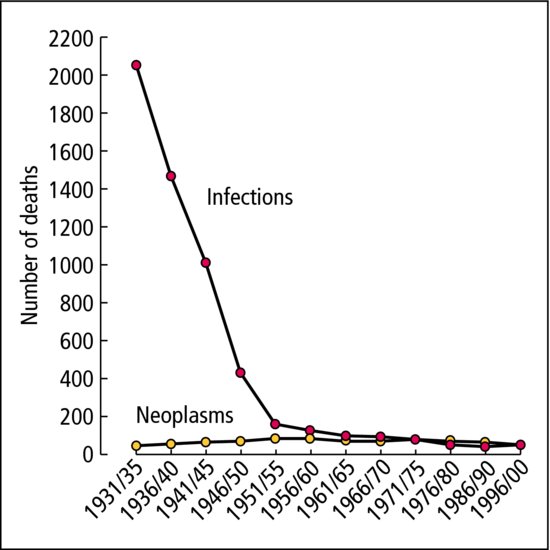
- The decline in mortality from infectious diseases has made other serious disorders appear more common. Death from malignancy is now as common as from infection (Figures 1.5 and 1.6).
Figure 1.5 Causes of death in childhood. Mortality ages 1–14 in 2003. Source: National Statistics Online at www.statistics.gov.uk.
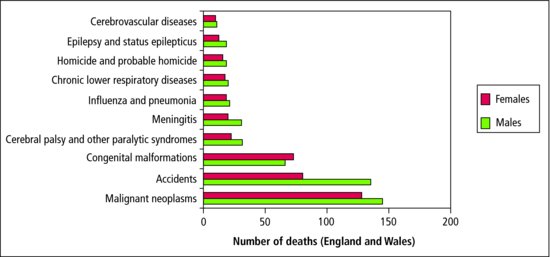
Figure 1.6 Child mortality from infections and neoplasms, per million children living (aged 1–4 years).
1.2.3 Childhood morbidity
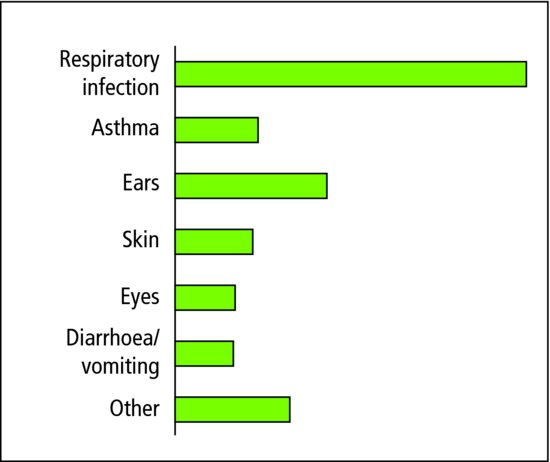
- The pattern of morbidity in children is very different from that of adults (Figure 1.7):
- Infections are common, especially of the respiratory, gastrointestinal and urinary tracts, as well as the acute exanthemata (e.g. chickenpox).
- Degenerative disorders and cerebral vascular accidents are very rare.
- Infections are common, especially of the respiratory, gastrointestinal and urinary tracts, as well as the acute exanthemata (e.g. chickenpox).
- New forms of chronic disease are becoming relatively more important as formerly fatal childhood disorders become treatable (but not necessarily curable):
- Children with complex congenital heart disease, malignant disease, cystic fibrosis and renal failure benefit from modern life-saving therapies but may not achieve a cure, and often have to live with the difficulties and side-effects of complicated treatment.
The hallmarks of childhood are growth and development, which influence both the kinds and the patterns of childhood illness. Congenital malformations, genetic disease and the consequences of problems in the perinatal period (e.g. cerebral palsy) are common. You do not need to spend much time looking after children to realize that disturbances of development and behaviour, and anxiety about normal variants, are both prevalent and important to parents.
It has been estimated that a British GP with an average practice would see a new case of pyloric stenosis every 4 years, childhood diabetes every 6 years, Down syndrome every 16 years, Turner syndrome every 60 years and haemophilia or Hirschsprung disease every 600 years! Hospitals may give a very false impression of the pattern of illness in the community at large.
1.3 Children in society
1.3.1 Socioeconomic inequalities
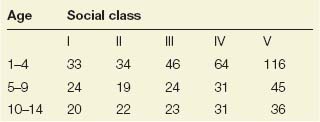
Socioeconomic status is a key determinant of child health. The health and educational progress of a child is directly related to the home and the environment. A child in social class V has a 50% greater chance of being born dead or with a serious physical handicap than one in social class I (see Table 1.2). The disadvantage is there at birth and continues throughout childhood. The social class IV or V child will have more accidents, more physical illnesses, will be smaller and will read less well than the child from social class I or II. At any age a child from social class V is twice as likely to die as one from social class I. In many developed countries, health inequalities have grown wider even as average health levels have improved.
Table 1.2 Social class and childhood mortality: death rates per 100 000.
The UK has one of the worst rates of child poverty in the industrialized world. The proportion of children living in poverty grew from 1 in 10 in 1979 to 1 in 3 in 1998. Today, 30% of children in Britain (nearly 4 million) are living in poverty. Since 1999, when the Government pledged to end child poverty, 550 000 children have been lifted out of poverty.

1.3.2 Changes in family structure
Family structure has become more fluid in the UK, reflecting changing societal attitudes to marriage, divorce and cohabitation. Children more often have to make transitions to new family structures. They are helped by: family stability; good relationships between partners; avoiding sustained exposure to conflict; and keeping children’s needs paramount. Although marriage has declined and 40% of births are now outside marriage, 7 out of 10 families are headed by a married couple. Step-family combinations are increasing. With more single-parent families, and families where both parents work, grandparents play a significant role in childcare (at least weekly for 25% of families); 23% of dependent children live in single-parent families. Although UK teenage pregnancy rates have fallen recently, they are still among the highest across developed countries. Half of all teenage mothers live in the 20% most deprived areas.
Home factors that can adversely affect children’s health and development include:
- Parental discord
- Quarrelling
- Separation and divorce
- Domestic violence
- Quarrelling
- Parental illness
- Death of a parent
- Chronic disability
- Physical illness
- Mental illness
- Death of a parent
- Inability to cope with demands of parenting
- Abuse
- Financial hardship.
The complexity and multiplicity of the factors that cause a child to be disadvantaged sometimes makes us feel helpless. However, since adversities compound one another, much may be achieved by modifying even one adverse factor.
Extensive medical and social services exist, particularly for handicapped children, but all too often they are best used by well-informed, middle-class parents, while the parents of the disadvantaged child do not use them sometimes because they do not know about them. All medical and paramedical staff have a duty to recognize children in need or in distress, and to see that they benefit from the help that is available.
Stay updated, free articles. Join our Telegram channel

Full access? Get Clinical Tree


