3
Charting the menstrual cycle
The BBT Chart
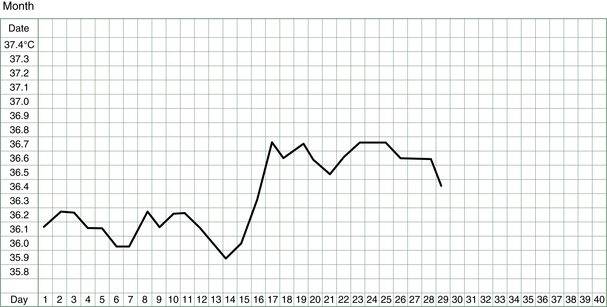
The basal body temperature (BBT) chart records the temperature of the body on waking. It is called basal because it is measured at a time when the body is deeply rested and the body’s metabolism and temperature is at its baseline. A woman’s basal body temperature rises after she has ovulated and begins to produce progesterone. In a typical menstrual cycle, a BBT chart looks something like that shown in Figure 3.1.
One of the very great strengths of Chinese medicine is discerning what is going on inside the body from watching or feeling what is going on on the outside of the body. Thus, the color and nature of the complexion tells us things about the functioning of the internal organs, as does the glint or lack thereof in the eyes, or the color and nature of the urine or the stools or the menstrual flow, or the strength of the artery at the wrist and inside the ankle, or the look of the tongue, and so on. The Chinese have observed so many minute details and over thousands of years correlated them with disease patterns or tendencies to manifest particular disease patterns but it was only in recent years that doctors in China incorporated into their battery of diagnostic skills two more external signs – namely, the change of basal body temperature observed during the menstrual cycle and the production of mucus by the cervix just before ovulation.
No matter who described the phenomenon first, TCM doctors have wasted little time in incorporating such useful observations into their diagnostic repertoire and have related quantity and quality of fertile mucus secretions to standard TCM diagnostic patterns.1
The How’s and Why’s of BBT Measurements and Other Observations
Recording the lowest body temperature each morning, and watching the secretions of the cervix and noting the changes in position in the cervix and then charting these observations will, over time, build an individual profile which is as informative as it is interesting. In addition, changes in breast symptoms, abdomen symptoms, bleeding patterns and general symptoms paint a picture that provides an accurate insight into the inner workings of those hormonal tides which ebb and flow each month.
History of the BBT Chart
More advances came when researchers in Australia, the two Dr Billings, examined the relationship of hormonal production, cervical secretions and ovulation.2 They were able to establish that there was a reliably reproducible cyclic pattern in the cervical discharges (in response to estrogen and progesterone production) and that the most dramatic and easily observed changes occurred before and after ovulation. The work of two professors working at Melbourne and Monash Universities also confirmed that women’s own awareness of their cervical mucus could indicate ovulation more accurately than measurements of hormones by blood tests.3
Now the contraceptive method, approved by the Catholic Church, could be developed to a sophisticated enough degree that it actually worked. In fact the sympto-thermal method, as it rather clumsily came to be called, boasts a success rate as a contraceptive method of 98%. This compares very favorably with the rate for the condom of 97% and the oral contraceptive pill of 99.5%.4 Teaching programs sprung up all over the Western world and the method is variously called FAM (fertility awareness method), NFP (natural family planning) or the Billings method. The method not only gave women a wonderful insight into the workings of their own bodies but also liberated them from the need to use chemicals and devices if they did not want to fall pregnant.
Of course the very useful corollary of this method which was developed as a contraceptive aid was that it also could work the other way – it could help women conceive. Knowing when you’re fertile and need to avoid intercourse became knowing when you’re fertile and need to have intercourse. Not only do the chances of falling pregnant rise dramatically when intercourse is timed appropriately but the pregnancies which result from the precise timing of conception are generally more secure and the incidence of miscarriage is lower.5
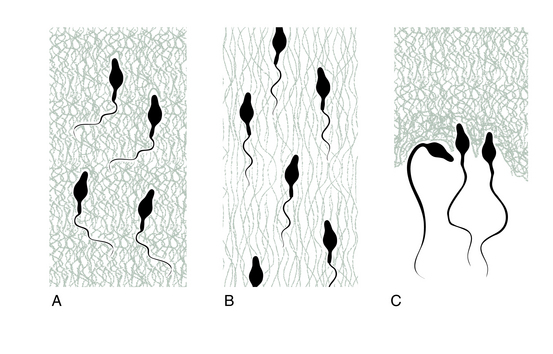
The more that was learned about the qualities of the fertile mucus, the more was learned about how some aspects of fertility can be enhanced or hindered. For example, observation of the behavior of sperm in the fertile mucus can uncover some impediments to conception. Sometimes the mucus is too acid, or too alkaline, or may contain antibodies. There are various ways these can be overcome. It may be as simple as douching with dilute vinegar, for an alkaline vagina, or sodium bicarbonate for a too acid one. Antibodies in the fertile mucus is a little more difficult to treat and is discussed later.
Charting the Cycle from Day 1
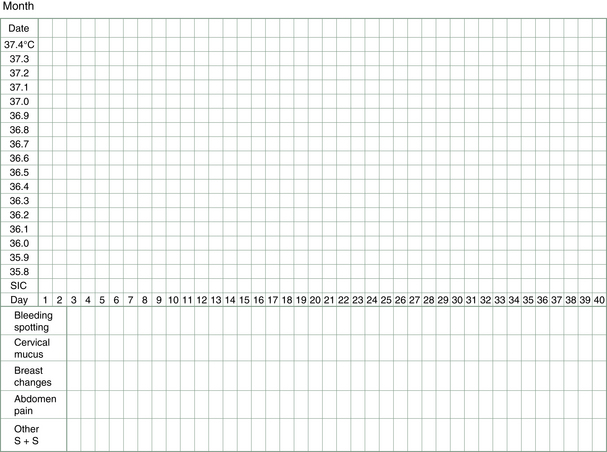
To start, all that is needed is a thermometer, a chart (see, e.g., Fig. 3.2) and a good night’s sleep (or at least 3–4 unbroken hours). For those women having regular menstrual cycles, charting starts at the beginning of a cycle, i.e., the first day of bleeding. For women not having periods or having them very sporadically, charting can start immediately but may be followed by a lengthy wait for a pattern to emerge.
Let us now go through the technique step by step.
The thermometer
The thermometer is removed, the temperature reading taken and its value noted on the chart under the correct day and date. For a mercury thermometer, it can be placed carefully on the bedside table and the reading taken some time later in the morning or even when going to bed the next evening. This is because most mercury thermometers will remain stable at the temperature they have reached until the mercury is given a firm shake down with a sharp flick of the wrist. After reading and recording the temperature, the mercury in the thermometer should be returned to its base level and the thermometer wiped clean ready for the next morning’s use.
It is important that the temperature is read at roughly the same time each morning, because later waking raises the basal body temperature. Thus, a very erratic-looking chart may reflect nothing more than a rather erratic sleep and waking pattern. Some studies have shown that the basal temperature rises 0.09°C for each hour of delayed rising in the morning.6 Thus, BBT charts can be adjusted for different waking times by moving the recorded temperature one square up or down for each hour of waking earlier or later than usual.
The urinary ovulation predictor kit
These kits can be used to test for the rise in luteinizing hormone (LH) prior to ovulation, i.e., at the later stages of the follicular phase. LH produced by the pituitary as the dominant follicle ripens usually does not last very long in circulation and so these kits test for a form of LH that has an extended life span due to transformation in the urine. It is recommended that the urine is tested during the day (not first thing in the morning) after avoiding liquids for about 2 h (so that the urine is not too dilute). A positive reading will show two colored lines with the test line being equal to or darker than the control line. This indicates the LH levels have risen and that an egg will probably be released within 12–48 h. Using the predictor kit in conjunction with the BBT is a useful strategy, especially if the fertile mucus signs are not pronounced. It gives a reliable guide to the most fertile days of the cycle and the best days to be having sex.
The chart
Each day the temperature is recorded on the chart, along with other observations related to fluctuations in the hormones (Fig. 3.2), e.g., changes in breast and nipple tenderness or swelling may be noticed or changes in abdomen bloating or discomfort, in sleep patterns, in moods, in food cravings and, most importantly, changes in vaginal lubrication and discharge (this latter can also include spotting of blood).
Fertile mucus
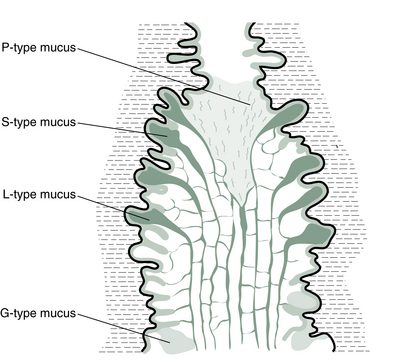
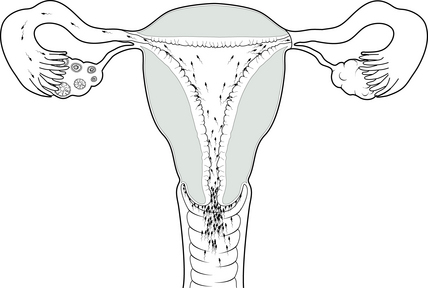
The estrogen peak, which stimulates the production of fertile mucus, usually starts on average 6 days before ovulation. Four different types of mucus are produced by specialized glands in the cervix in response to this estrogen (Fig. 3.3).7 The cervical discharge produced at infertile times (i.e., at all times except ovulation) is associated with a dry feeling at the vulva. It is called G-type mucus and is thick, pasty and impenetrable. It is produced in crypts of the cervix at the end of the cervical os nearest the vagina (Fig. 3.4). As estrogen levels begin to rise, the cervix produces, from crypts a little higher in the cervix, the more liquid L-type of mucus. This causes the vaginal sensation to be more sticky or wet. As ovulation approaches, crypts still higher in the cervical os produce mucus which is more stretchy and slippery. It is this S-type mucus that is sometimes referred to as the egg-white-like mucus. The sensation at the vulva now is distinctly wet and strings of S mucus, sometimes mixed with clumps of L mucus, may be noticed. The phenomenon which gives this mucus its elasticity is called spinnbarkeit, or ‘spinn’ for short.
Fertile mucus forms graphic ferning patterns when it is dried on a smooth surface such as a glass microscope slide. The three different types of fertile mucus crystallize in three distinct patterns: the L mucus makes intricate and many branched ferns; the S mucus makes delicate pine needles lined up close and parallel; and the P mucus makes hexagons (Fig. 3.5).

A summary of fertile mucus characteristics is given in Table 3.1.
Table 3.1
Summary of fertile mucus characteristics
| Characteristics | Function | |
| G type | Thick, pasty and impenetrable | Blocks entrance to uterus |
| L type | Sticky or wet. When dried, makes intricate branched ferns | Catches and filters out some of the abnormal or poor-quality sperm before they reach the uterus |
| S type | Stretchy and slippery like egg white. When dried, makes delicate pine needle shapes | Creates or facilitates pathways for sperm entry to the uterus |
| P type | Lubricating. When dried, makes hexagons | Activates sperm as they pass through the cervix to the uterus |
One easy way to evaluate quality and quantity of cervical secretions is to collect a little from the vaginal entrance (if it is plentiful enough) or gently from the cervical surface itself (if it is less plentiful) with clean fingers and see how much elasticity there is as the fingers are drawn apart (Fig. 3.6). Some women prefer to use toilet tissue to collect the fluid or rely on sensations of moisture alone. Some teachers of the Billings’ method stress learning to interpret the subjective sensations of dryness or lubrication at the vulva without further investigations using the fingers (presumably to avoid introducing infection to the vagina or for cultural reasons when this method is taught in developing countries).
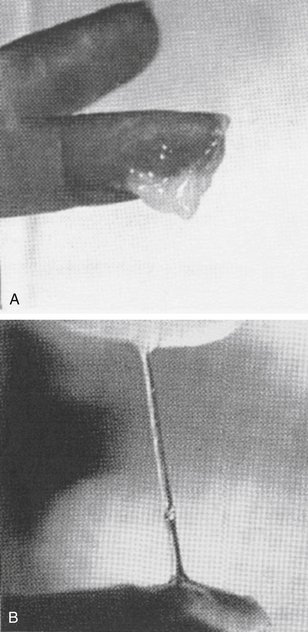
Figure 3.6 Examination of stretchy fertile mucus. (A) G-type mucus – no spinn. (B) S-type mucus – spinn.
The importance of recognizing the changes in the fertile mucus lies in the fact that it precedes ovulation and therefore alerts a woman to her most fertile days. The last day of any fertile mucus, whether seen as a secretion from the vagina or felt as a moist sensation, is often referred to as the ‘peak day’. This refers to the day of peak fertility, the day before or the day the egg is released. Nature’s design for conception is not random at all but has designed very exact timing. Producing the fertile mucus to facilitate the sperm’s journey up the cervix in the days before ovulation is aimed at getting these sperm inside the female reproductive tract well before the egg is released (Fig. 3.7). This is because this largest single cell in the body is one of the shortest lived, being fertilizable for only 6–12 h. Some of the millions of lively little sperm cells, on the other hand, have been known to survive for 5 days in the female reproductive tract, although they are most able to fertilize the egg in the first 48 h after delivery to the vagina. So, ideally, there will be a bunch of some hundreds of eager sperm that have survived the hazardous journey as far as the fallopian tubes, lying in wait for the egg as she is launched. Some studies have indicated that the day for sexual intercourse which then leads to the highest conception rate is, in fact, 2 days before ovulation.
< div class='tao-gold-member'>
Stay updated, free articles. Join our Telegram channel

Full access? Get Clinical Tree


