Eirik Nestaas, Drude Fugelseth, Beate Horsberg Eriksen Key points Echocardiography is widely used to assess systemic blood flow and heart function in the newborn infant. This chapter gives an overview of conventional echocardiographic methods for the assessment of systemic blood flow, ventricular size, and myocardial function in newborns in the absence of congenital heart defects. Reliable methods to monitor cardiovascular and hemodynamic function are important for assessment of circulatory disturbances and guide optimal therapy in the newborn infant.1,2 Evidence of functional echocardiography improving neonatal outcome is emerging in the form of observational studies showing changes in care and reduced use of medications for patent ductus arteriosus (PDA) treatment and inotropes for borderline hypotension with normal systemic blood flow.3,4 Two-dimensional (2D) and Doppler echocardiography is useful to assess hemodynamic status in routine clinical practice, as well as in clinical research. A complex integration of different echocardiographic modalities is necessary for the assessment of structure and dimension, blood flow, myocardial function, and loading conditions. Basic knowledge of physical and technical principles of the different modalities, sufficient operator skills, and experience in measuring relevant echocardiographic indices, as well as a comprehensive understanding of normal physiological and pathological processes, are essential for the optimal use of echocardiography.5 Echocardiography has a central role in diagnosing and monitoring congenital heart disease, screening for PDA in preterm neonates, assessing heart function and pulmonary hemodynamics, detecting pericardial or pleural effusion and thrombosis, and verifying central line placement.6 The most common scenarios for functional echocardiography in neonates are circulatory assessment during the transitional circulation period in very premature infants, assessment of PDA beyond the early transitional period, exploration of the reasons for circulatory compromise and hypotension, and diagnosis and following of treatment for persistent pulmonary hypertension of the newborn. Understanding the physiology of cardiovascular adaptation after birth and the effect of diseases and prematurity are key factors in interpretation. The complex and dramatic cardiorespiratory changes that take place during the transitional phase from fetal to neonatal circulation may be critical in both preterm and sick term infants. The onset of breathing promotes a rapid decrease in pulmonary vascular resistance, with a subsequent increase in pulmonary blood flow.7 The augmentation in pulmonary venous return increases the left heart preload and enables the left heart to handle the raised afterload following cord clamping and disconnection of the low-resistance placenta circuit.8–10 Chapter 6 discusses the effects of the timing of cord clamping on cardiovascular transition. While the right ventricle (RV) plays the dominant role in fetal life, the left ventricle (LV) gradually dominates after birth. Closure of the fetal shunts normally starts with functional closure of the foramen ovale due to the altered pressure difference between the left and right atria, even though a small left-to-right shunt across the foramen ovale may be persistent over time. The changes in pulmonary and systemic vascular resistance after onset of breathing and cord clamping reverse the shunting of blood through the ductus arteriosus from right-to-left shunting to left-to-right.11 In term neonates the functional closure of the ductus arteriosus normally takes place within the first 2–3 days of postnatal life, while the ductus venosus may be persistent for several days after birth.12–14 A variety of conditions in the perinatal period, such as asphyxia, respiratory distress, sepsis, and metabolic and hematological diseases, as well as positive pressure ventilation, may affect the cardiovascular system and hence disturb the transitional phase. Persistent high pulmonary vascular resistance might be due to fetal and/or perinatal hypoxia, resulting in abnormal pulmonary vascular development and/or responsiveness to local vascular mediators or to hypoxia caused by lung disease or apnea.15 Typical findings in pulmonary hypertension are bidirectional flow across the foramen ovale, bidirectional or right-to-left flow across the ductus arteriosus, and increased RV afterload, especially in the case of restrictive ductal flow. The latter may affect coronary blood flow and subsequently myocardial perfusion and function. The resultant decrease in left ventricular filling further affects myocardial function. Systemic circulatory failure (shock) may develop due to low systemic blood flow.16 Preterm infants are especially vulnerable in the transitional circulatory phase (see Chapter 7). The fetal myocardium has a higher water content and a less organized structure compared to later in life. Mononucleated cardiomyocytes, fewer sarcomeres, and different isoforms of contractile proteins make the heart less compliant, with reduced cardiac functional reserves and less contractile ability.17–19 The immature heart is less tolerant to the abrupt changes in preload and afterload at birth.20,21 In preterm neonates with a PDA the effect of the gradually increasing left-to-right ductal shunting on cardiac performance has opposite effects on the pulmonary and the systemic circulation. It contributes to the increased pulmonary blood flow immediately after birth,22 but a significant left-to-right shunt may impair systemic blood flow and cause a deterioration in cardiac performance and organ perfusion.23 When the blood flow decreases, compensatory mechanisms redistribute the blood supply to vital organs by selective vasodilatation and vasoconstriction. In this compensatory phase of shock the blood pressure can remain normal, although the blood supply to the body is low.24 As long as the net systemic vascular resistance is higher than normal, the blood pressure can remain normal despite reduced systemic blood flow. Applying the indices discussed in this chapter can help the intensivist to identify shock in this compensatory phase, enabling intervention at an early stage. Systemic blood flow is a complex and dynamic variable with rapid fluctuations caused by the changes in activity and metabolic demand of the different organs. Doppler echocardiography offers direct and indirect measures of systemic and organ blood flow.25 Blood flow by Doppler echocardiography is calculated as the product of the displacement of the velocity profile, called the velocity-time integral (VTI) of blood flow velocity, the cross-sectional area of the vessel at the site of the measurement, and the heart rate. VTI is measured by tracing the pulsed Doppler velocity signal. The cross-sectional area is found by measuring the diameter (D) and calculating the area as (π × (D/2)2).26 Assuming a circular vessel with constant cross-sectional area, blood flow (volume per time, usually mL/min) is calculated as (VTI [for one heartbeat] × cross-sectional area × heart rate).27,28 A prerequisite for this calculation is a laminar parabolic flow profile representative of long, straight blood vessels under steady flow conditions, meaning that blood in the entire cross-sectional area moves at the speed drawn as the outer edge of the VTI. This prerequisite is probably met to a less extent in venous than arterial vessels, as is the assumption of a circular cross-sectional shape of the vessel. Blood flow in neonates is usually indexed by weight (mL/kg/min) and not body surface area because neonates and children have a relatively larger body surface area compared with body weight than adults. This results in non-linear-indexed hemodynamic variables.29 It is important to minimize the angle of insonation when obtaining the VTI and to assess the diameter with the ultrasound beam perpendicular to the vessel at the true (maximal) diameter. An inappropriate angle will underestimate the VTI and overestimate the diameter. Due to the squaring of the radius in the formula, inaccurate measures of the diameter may have considerable influence. We recommend averaging the measurements from a minimum of three cardiac cycles to minimize measurement error.30 Intra- and inter-observer variability significantly affects the Doppler flow measurements.31 Variation between measurements may be within the range of 30% in arteries and 50% in veins.32 Left ventricular output (LVO) reflects the systemic blood flow in the absence of ductus arteriosus shunt. We measure the Doppler flow velocity from the left ventricle at the aortic valve or in the ascending aorta from an apical window (Figure 10.1). Measuring LVO in neonates may be challenging due to the curving of the ascending aorta, which leaves the heart ascending to the left- and backward, making the angle of insonation more inaccurate compared to adults. A reproducible left outflow diameter is easier to achieve. There are different opinions about where to measure the diameter; from the low parasternal window at the hinge of the aortic valve cusps or just beyond the sinus of Valsalva in the ascending aorta.33 It is important to perform serial measures in a consistent way. Accurate measures require assessment of the VTI and cross-sectional area at the same locality. Several studies have validated flow measurements by VTI and cross-sectional area against other techniques.27,30,34,35 Importantly, LVO will overestimate systemic blood flow if there is a large left-to-right shunting across the ductus arteriosus, which is especially relevant in preterm infants.28 In the extreme situation of persistent pulmonary hypertension of the newborn with right-to-left shunting, LVO may underestimate true systemic blood flow. Right ventricular output (RVO) may be a more feasible index for systemic blood flow in neonates and especially in preterm babies.36 Changes in RVO are associated with multiple factors, such as placental transfusion, gender, condition at birth, and early respiratory adaptation.37 Even though shunting of blood across the foramen ovale may contribute to RVO measurement, the magnitude of atrial shunting is usually less than the ductal shunting28 and impaired systemic blood flow is therefore extremely rare when the RVO is normal. In the first 48 hours after birth, if the peak pulmonary valve velocity is more than 0.45 m/s, low systemic blood flow is unlikely.36 Since the main pulmonary artery directs posteriorly, it is usually possible to obtain an optimal insonation angle for velocity measurements from the parasternal view (Figure 10.2). Measurement of pulmonary artery diameter may be challenging and is best obtained at the valve leaflet insertion from a slightly higher or tilted parasternal long-axis view.38 The normal cardiac output from both left and right ventricle in neonates gradually increases after birth and is in the range of 150–300 mL/kg/min.28 Due to the influence of fetal shunts on cardiac output from both ventricles, assessment of cardiac input from the upper body by SVC is recommended as an additional measure for global cerebral and systemic blood flow in the transitional period.39 As the brain is one of the main target organs for adequate perfusion, the focus on the return of blood from the upper body and brain may be justified, even though only 30% of the blood in the SVC may represent blood returning from the brain in preterm neonates.39 Prolonged periods of low SVC flow indicate poor cerebral perfusion and are associated with increased risk of morbidity and mortality.39–42 From the low subcostal window, a desirable angle of insonation for Doppler velocity measurement is obtained (Figure 10.3). Usually, the SVC VTI is biphasic with one positive peak in systole (S wave) and a smaller positive peak in early diastole (D wave), and a minimal positive or negative peak during atrial contraction (A wave). The negative A wave may increase in pathological situations, with increased pressure on the right side or high positive pressure ventilation. The original description of the technique recommends subtracting any significant negative peaks when assessing the VTI and averaging the VTI from 10 cardiac cycles due to the impact of respiration and the variations in the velocity profile (Figure 10.3).39 As for the other estimates of blood flow, it is important to assess the VTI and the cross-sectional area of the vessel from the same place. The preferred measurement of the SVC diameter is at the entrance to the right atrium just prior to the “funneling” or opening up of the vessel into the right atrium from the long-axis low to mid-parasternal view (Figure 10.3). Because SVC diameter varies more in size than the great arteries, it is recommended to measure the average of the maximum and minimum diameter over several heart cycles (minimum five) either on a 2D image or by use of M-mode.39 Mean SVC flow is associated with gestation and increases from about 70 mL/kg/min to 90 mL/kg/min from 5 to 48 hours postnatally. The normal range is 40–120 mL/kg/min.37,39 The technique for measuring SVC flow by ultrasound has limitations. Although Doppler measures of arterial blood flow in the central circulation have good reproducibility and correlate well with invasive measures of blood flow, as discussed above, it is debated if the calculation developed for arterial flow is valid for venous flow. The most important methodological problems with the assessment of SVC flow relate to the uncertainty of calculating the cross-section area of the vein. The formula pre-supposes a perfect round vessel and uses the square of the vessel radius to calculate a static cross-sectional area. These geometrical pre-suppositions, and the squaring of linear data, amplify measurement errors. A modification of the technique for measuring SVC flow has been published.30 By interrogating the SVC Doppler flow from a suprasternal window, and measuring the cross-sectional area from a short axis view where the maximum and minimum cross-sectional area were directly traced, the agreement with magnetic resonance imaging–derived SVC flow was better. Additionally, the measure had less intra-user variation. The mid-panel of Figure 10.3 shows the SVC in cross-sectional view where a direct area tracing may be measured. One magnetic resonance imaging study found the SVC method to be inaccurate32 but others have criticized the study for not fulfilling standard criteria for repeated measurement validations.43 Several guidelines for functional echocardiography in neonates do recommend the use of SVC flow, and low SVC flow is associated with adverse long-term outcome.5,24,44,45 Calculation of cavity function indices involves assessment of changes between the largest and smallest cavity measurements in the cardiac cycle (usually end-diastole and end-systole). Indices based on percentage change between measurements or sizes describe heart function relatively independently of heart size. More geometrical assumptions are a prerequisite for the estimate of cavity sizes from unidimensional measurements compared to 2D measurements. LV function indices are the most frequently used indices of heart function in neonates. Despite growing evidence of its shortcomings and low ability to detect pathology and maturational changes,46–51 the most frequently used cavity index in neonates is fractional shortening (FS). FS is assessed as the relative change during the cardiac cycle in the internal diameter of the LV. Diameters relate closely to bodyweight (Table 10.1) and normal FS values reported are often 30–45% in neonates46–49,52 with little variation by weight. FS can be obtained from the parasternal or subcostal views38,53 using M-mode or 2D images (Figure 10.4). The diameter is assessed perpendicular to the cavity at the tip of the mitral valve leaflets.38 Its use as a cavity measure has, as a prerequisite, normal LV geometry and symmetric contraction, including normal septal motion.38,53
Chapter 10: Assessment of systemic blood flow and myocardial function in the neonatal period using ultrasound
Introduction
Assessment of systemic blood flow by ultrasound
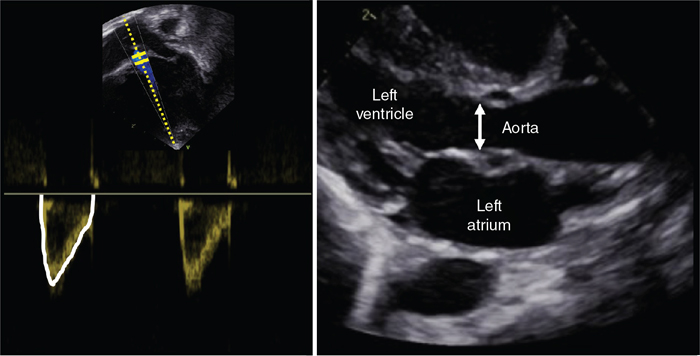
Left ventricular output
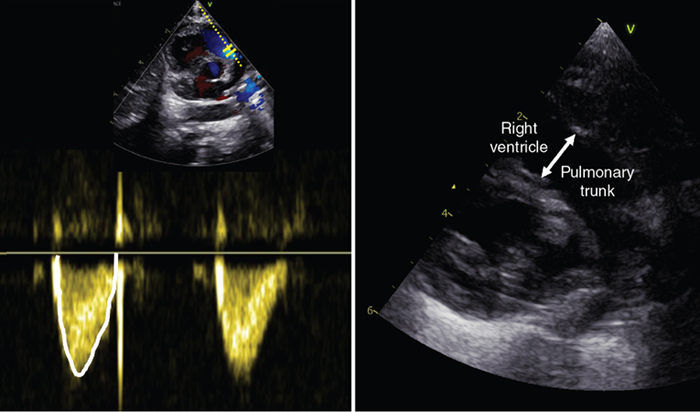
Right ventricular output
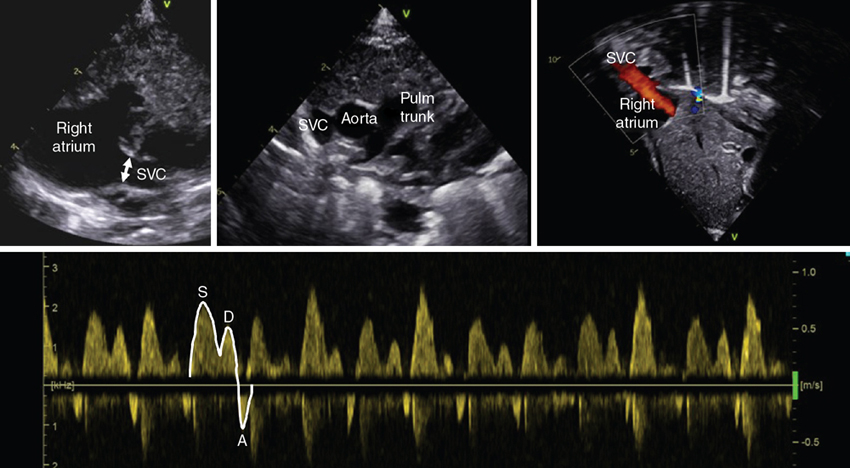
Superior vena cava flow
Cavity measures
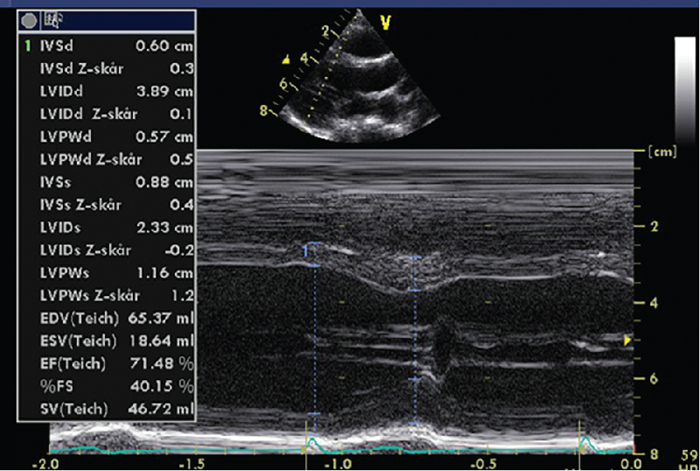
Cavity measures of the left ventricle
![]()
Stay updated, free articles. Join our Telegram channel

Full access? Get Clinical Tree


Obgyn Key
Fastest Obstetric, Gynecology and Pediatric Insight Engine
