Fig. 24.1
The Frankfurt plane extends from the auditory meatus to the lower border of the orbit. For proper measurement of height, the Frankfurt plane should be parallel to the floor as shown in the figure
Genetic potential for growth can be estimated if the heights of both biological parents are available. These should be recorded on the growth chart and the mid-parent height computed (the average height of the mother and father). Tables with the values to adjust a child’s height based on mid-parent height are age- and sex-specific, so periodic re-evaluation of genetic potential for growth is warranted [21]. The child’s adjusted height (based on the tables) and measured height can be plotted on the growth chart to assess the degree to which the child’s height deviates from their genetic potential.
Growth Velocity
Growth velocity is calculated as the change in height (or weight) divided by the time (or age change) between measurements. For example:
![$${\text Height \,Velocity}({\text cm/y})=[{{\text Height}}_{2}-{{\text Height}}_{1}]/[{{\text Age}}_{2}-{{\text Age}}_{1}]$$](/wp-content/uploads/2016/09/A126025_2_En_24_Chapter_Equ0024a.gif)
![$${\text Height \,Velocity}({\text cm/y})=[{{\text Height}}_{2}-{{\text Height}}_{1}]/[{{\text Age}}_{2}-{{\text Age}}_{1}]$$](/wp-content/uploads/2016/09/A126025_2_En_24_Chapter_Equ0024a.gif)
For children who are not fully mature, growth velocity is an excellent indicator of current nutritional status and well-being. Growth velocity varies with age, sex, maturational status, and season, so these factors must be considered in interpreting velocity measures.
There are several reasons why growth velocity measurements should be used cautiously. The accuracy of the growth velocity measurement is particularly sensitive to the accuracy and precision of the measurements on which it is based. Growth velocity is derived from two measurements at different time points, each with their own measurement error. Consequently, the measurement error associated with the velocity is even greater than that of a single measurement. For example, as shown by Voss et al. [22], a height measurement of a 5-year-old child at the third percentile for age has a 95% confidence interval that spans the second to the fourth percentile. In contrast, a 12-month height velocity for that child has a 95% confidence interval ranging from the 8th to the 52nd percentile.
Growth velocity should be calculated over a 6- or 12-month interval depending on the velocity reference standards to be used. Assessment of growth velocity over a longer or shorter interval than that used in the standards may overestimate or underestimate the true velocity, in part due to seasonal fluctuations in growth velocity and other growth spurts.
Anthropometric Indicators of Nutritional Status
Anthropometric indicators of nutritional status primarily reflect energy and protein status. The most commonly used indicator is body mass index, an overall indicator of relative weight that is sensitive to overnutrition and undernutrition. Additional indicators, based on upper arm anthropometry (mid-upper arm circumference and the triceps skinfold thickness), provide estimates of lean and fat tissues at sites known to be sensitive to nutrition and health.
Body Mass Index
An optimal relative weight measure is one that is an index of weight independent of height. In adults, body mass index is a simple relative weight measure that has a zero correlation with height and does not vary significantly by gender. Therefore, among adults, the nutritional classification scheme is based on ranges of BMI as shown in Table 24.1. For children, body mass index varies significantly with age and sex, so it is critical to compare body mass index values to the Centers for Disease (CDC) charts to determine the body mass index percentile for age. For children, a classification scheme for overweight and obesity based on body mass index has been defined as shown in Table 24.1. However, there are no established guidelines for underweight based on body mass index in children. Above all, it is important to recognize that these definitions are intended as screening classifications, requiring further medical evaluation to more accurately assess nutritional status and related health concerns [23].
Pediatric ranges | Adult ranges (kg/m2) | Nutritional status classification |
|---|---|---|
Undetermined | Less than 18.5 | Undernourished |
<85th percentile | 18.5–25 | Healthy weight |
85th to 95th percentile | 25–30 | Overweight |
Greater than 95th percentile | Greater than 30 | Obese |
Upper Arm Anthropometry
Mid-upper arm circumference is a good measure of short-term nutritional status. It is a summary measure of muscle, fat, and bone on the arm, and is an easily accessible measurement site requiring simple equipment. A nonstretchable flexible measuring tape should be used with measurements accurate to 0.1 cm. The right arm should be measured. If the right arm is in a cast or the child has a disability affecting the right arm, the left arm should be measured; this deviation from standard measurement procedure should be recorded along with the measurement so that follow-up measurements will be recorded at the same location for purposes of comparison.
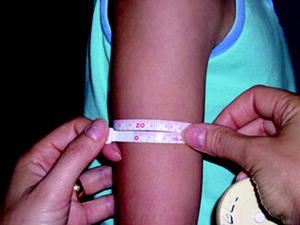
The midpoint of the upper arm must first be identified by measuring arm length. The measurement of arm length is taken with the arm flexed at 90° and the palm facing upward. The midpoint of the upper arm is located midway between the tip of acromion process and the olecranon [20]. The midpoint should be marked with a washable ink pen. Prior to measuring arm circumference, the arm should be extended to a fully relaxed position (gently shaking the arm usually assures that it is relaxed). The circumference measurement is taken over the marked midpoint with the tape perpendicular to the long axis of the arm (Fig. 24.2). Good measurement technique involves checking to be sure there is no pinching or gaping of the tape as it encircles the arm.


Fig. 24.2
Mid-upper arm circumference is taken at the mid-point of the upper arm. The flexible tape measure should be positioned perpendicular to the long axis of the arm so that there is no pinching or gaping
The triceps skinfold thickness is taken at the same location as the mid-upper arm circumference over the triceps muscle on the back of the upper arm [20]. It is a measure of subcutaneous fat stores, serving as an overall indicator of energy stores. It correlates well with total body fat measured by other techniques. Spring-loaded skinfold calipers are needed to measure skinfold thickness accurately. Holtain skinfold calipers are scaled to 0.2 mm and Lange calipers are scaled to 0.5 mm.
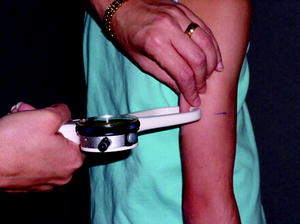
To measure the triceps skinfold thickness, the child should be upright with their arm hanging down in a relaxed position (Fig. 24.3). The fold of skin and subcutaneous fat are grasped into a distinct fold that aligns with the long axis of the arm, lifting it away from the underlying triceps muscle. The skinfold is grasped 2 cm above the upper arm mid-point level marked previously, so that the calipers can be positioned at the same location as the mid-upper arm circumference measurement. While continuously holding the skinfold in position, the calipers are placed at the midpoint mark (below the fingers lifting up the fold) and released so that they exert a constant pressure on the subcutaneous fat fold. The reading should be taken 3 s after releasing the caliper’s handles.


Fig. 24.3
The triceps skinfold thickness is taken at the same location as the mid-upper arm circumference using skinfold calipers
Calculation of Upper Arm Fat Area and Upper Arm Muscle Area
The mid-upper arm circumference and triceps skinfold thickness can be combined to calculate upper arm fat area and upper arm muscle area. These measures correlate well with total body stores of fat and muscle. However, unlike total body measures of fat and muscle, reference data from the National Health and Nutrition Examination Survey for these measures are available for upper arm fat area and muscle area so that they can be used in the clinical setting.
The formulas for calculating upper arm fat area and upper arm muscle area are as follows:

![$${\text Arm \, Muscle \, Area}({{\text mm}}^{2})={[{\text Armcirc}-({\text triceps}\times \pi )]}^{2}/(4\times \pi ),$$](/wp-content/uploads/2016/09/A126025_2_En_24_Chapter_Equ0024c.gif)


![$${\text Arm \, Muscle \, Area}({{\text mm}}^{2})={[{\text Armcirc}-({\text triceps}\times \pi )]}^{2}/(4\times \pi ),$$](/wp-content/uploads/2016/09/A126025_2_En_24_Chapter_Equ0024c.gif)

Note: arm circumference can be converted from cm to mm by multiplying by 10, and π = 3.14
Use of Reference Data
Appropriate use and interpretation of reference data are critical in the anthropometric assessment of growth and nutritional status. Anthropometric measures change with age and differ by sex, and the rates of change also vary by age. Therefore, comparison of a child’s measurements with age- and sex-specific reference ranges is a powerful index of their status. For example, it is not possible to determine if a weight of 25 kg is a healthy weight for a child unless compared to the age- and sex-specific reference percentiles for weight. Similarly, a child may gain weight between visits, but failure to maintain their weight percentile is a potential indicator of inadequate energy intake to sustain normal growth.
For screening purposes, the fifth percentile of reference data is often referred to as a cut-off point for growth failure or failure-to-thrive. By definition, 5% of the reference population had values below the fifth percentile, so it is important to recognize that values below this cut-off point are not necessarily abnormal. For children who are at risk for nutritional complications, the fifth percentile may be too low a threshold. The 25th percentile may be a more appropriate point for further nutritional evaluation or intervention to prevent nutritional complications. For children whose status is above the 25th percentile, failure to maintain percentile rank may also represent declining growth and nutritional status.
Ideal reference data should be based on a large, representative sample of children from a well-nourished population, with appropriate characterization of the variability in the population. Table 24.2 lists the recommended reference data for anthropometric measures of growth and nutritional status for children greater than 2 years of age.
Table 24.2
Recommended reference data for the assessment of growth and nutritional status
Measure | Reference data source |
|---|---|
Height | CDC growth charts [35] |
Weight | CDC growth charts [35] |
Body mass index | |
Growth velocity
Stay updated, free articles. Join our Telegram channel
Full access? Get Clinical Tree
 Get Clinical Tree app for offline access

|