Chapter 13 Assessment of Growth
A critical component of pediatric health surveillance is the assessment of a child’s growth. Growth results from the interaction of genetics, health, and nutrition. Many biophysiologic and psychosocial problems can adversely affect growth, and aberrant growth may be the first sign of an underlying problem. The most powerful tool in growth assessment is the growth chart (see Figs . 9-1, 9-2, and 13-1 on the Nelson Textbook of Pediatrics website at www.expertconsult.com  ) used in combination with accurate measurements of height, weight, head circumference, and calculation of the body mass index (BMI).
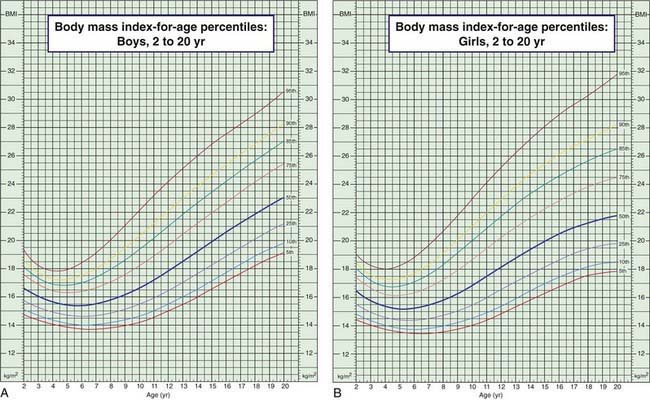
Figure 13-1 Body mass index (BMI) percentiles for boys (A) and girls (B) age 2-20 yr. (Official Centers for Disease Control [CDC] growth charts, as described in this chapter. The 85th to 95th percentile is at risk for overweight; >95th percentile is overweight; <5th percentile is underweight. Technical information and interpretation and management guides are available at www.cdc.gov/nchs.)
Derivation and Interpretation of Growth Charts
The data are presented in 5 standard gender-specific charts: (1) weight for age; (2) height (length and stature) for age; (3) head circumference for age; (4) weight for height (length and stature) for infants; and (5) BMI for age for children over 2 yr of age (Fig. 13-1; also see Figs. 9-1 and 9-2). The charts are available at www.cdc.gov/growthcharts/.
Each chart is composed of percentile curves, representing the cross-sectional distribution of weight, length, stature, head circumference, weight for length, or BMI at each age. The percentile curve indicates the percentage of children at a given age on the x-axis whose measured value falls below the corresponding value on the y-axis. On the weight chart for boys 0-36 mo of age (see Fig. 9-1A), the 9 mo age line intersects the 25th percentile curve at 8.6 kg, indicating that 25% of the 9 mo old boys in the National Center for Health Statistics sample weigh less than 8.6 kg (75% weigh more). Similarly, a 9 mo old boy weighing more than 11.2 kg is heavier than 95% of his peers. The median or 50th percentile is also termed the standard value, in the sense that the standard height for a 7 mo old girl is 67 cm (see Fig. 9-1B). The weight-for-height charts (see Fig. 9-2) are constructed in an analogous fashion, with length or stature in place of age on the x-axis; the median or standard weight for a girl measuring 110 cm is 18.6 kg.
In an effort to set an internationally usable standard for optimal growth in young children, in 2006 the World Health Organization released growth charts based on the Multicenter Growth Reference Study (MGRS). Rather than describing the growth of typical children, the MGRS describes the growth of children who are predominantly breast-fed and raised under optimal conditions. Six study sites representing 5 continents were included: USA, Brazil, Norway, Ghana, Oman, and India. Use of the new charts in developing nations results in identification of many more children as malnourished and eligible for therapeutic feeding programs. Their use in the USA results in many fewer infants being identified as underweight (comparison of curves shown in Fig. 13-2). Charts are available online at www.who.int/childgrowth/standards/en/.
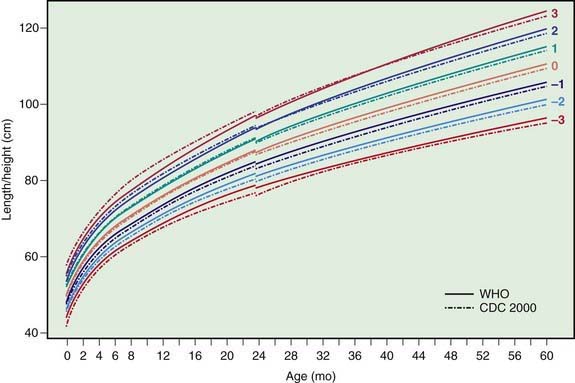
Figure 13-2 Comparison of the WHO and CDC length/height-for-age z score curves for boys.
(From de Onis M, Garza C, Onyango AW, et al: Comparison of the WHO child growth standards and the CDC 2000 growth charts, J Nutr 137[1]:144–148, 2007.)
Stay updated, free articles. Join our Telegram channel

Full access? Get Clinical Tree


