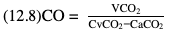
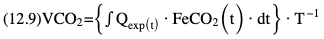
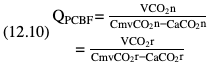
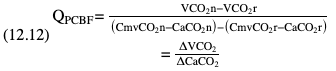
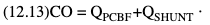
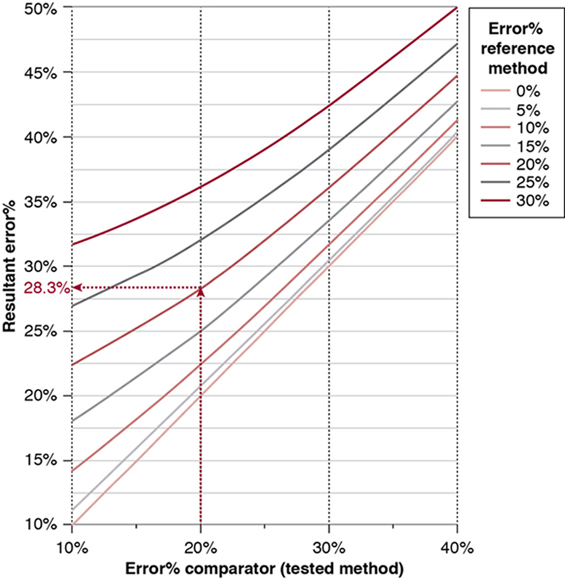
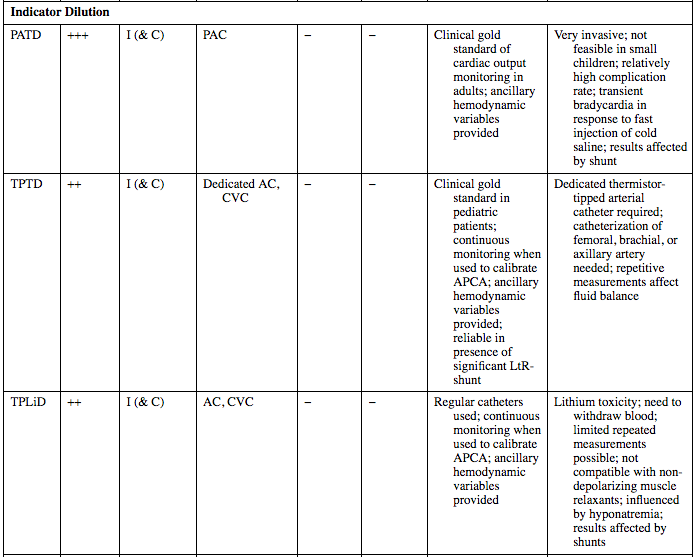
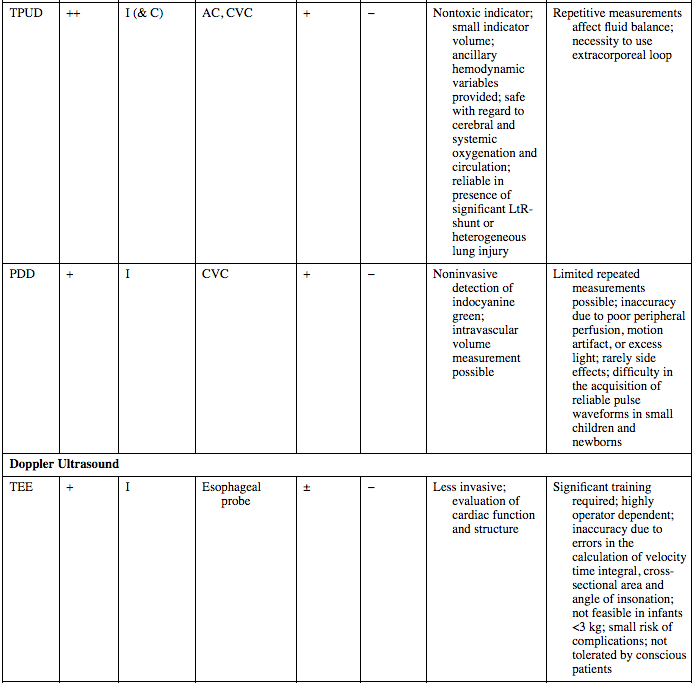
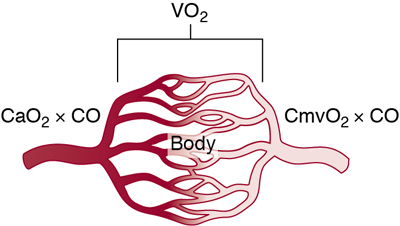
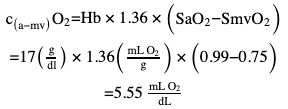
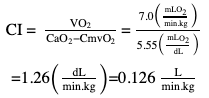
Willem-Pieter de Boode, Shahab Noori Key points Appropriate monitoring of the cardiovascular system and thus treatment of critically ill neonates with cardiovascular compromise hinge on the ability to monitor at least two of the three interdependent cardiovascular parameters (blood pressure, cardiac output, and systemic vascular resistance), determining systemic blood flow and thus systemic oxygen delivery. In the following equation the Hagen-Poiseuille law is applied to systemic blood flow (similar to Ohm law in electrical circuits): where CO is the cardiac output (i.e., systemic blood flow); (SABP − RAP) is the pressure difference between systolic arterial blood pressure (SABP) and right atrial pressure (RAP); and SVR is systemic vascular resistance. Oxygen delivery can be calculated when cardiac output and arterial oxygen content are known: where DO2 denotes oxygen delivery to the tissues, CO is the cardiac output, and CaO2 is the arterial oxygen content. At present, only blood pressure can be monitored continuously in absolute numbers in real time, albeit only invasively (see Chapter 3). Since reliable monitoring of SVR is not possible at present, continuous, noninvasive real-time assessment of beat-to-beat cardiac output has become the “holy grail” of modern-day neonatal intensive care. This is even more relevant considering the limited ability to clinically assess cardiac output using indirect parameters of systemic blood flow irrespective of the experience level of the clinician.1–3 With the ability to continuously monitor both blood pressure and cardiac output in real time, the neonatologist is able to more accurately diagnose and perhaps treat neonatal shock (see Chapters 1, 21-24). Several methods of cardiac output measurement are available. However, not all technologies are feasible in neonates due to size restraints, potential indicator toxicity, risk of fluid overload, difficulties in vascular access, and the presence of shunts during the transitional phase and in patients with congenital heart defects. A classification of the different methods used for cardiac output measurement is depicted in Box 12.1. An ideal method for the assessment of cardiac output is expected to include appropriate validation for accuracy and precision in real-time and absolute numbers, as well as trending ability. In addition, the ideal method should be continuous, reliable, practical, affordable, and easy to use and document. Finally, its ability to assess systemic blood flow in neonates with extra- and intracardiac shunting is an important requirement. Currently, none of the available methods are even close to fulfilling all these requirements. It is of the utmost importance to pay attention to the validation of cardiac output monitoring systems prior to their introduction into clinical practice. Validation studies, especially in preterm neonates, are scarce and generally include only small numbers of patients. A new technology for cardiac output measurement must be validated against a gold standard reference method that is known to be accurate and precise and does not affect the technology being tested. Ideally, this means validation against transit time flow probes, since this is considered the optimal in vivo reference method with a variability of less than 10%.4–6 The flow probe should be positioned around the pulmonary artery, since this will represent true systemic blood flow in the absence of shunts. Placing the flow probe around the ascending aorta will underestimate systemic blood flow, because coronary blood flow is not taken into account.7 Given the invasiveness of this reference method, its use is generally limited to animal studies. The Fick technology and the transpulmonary thermodilution (TPTD) cardiac output measurement are considered the clinical gold-standard methods in pediatric critical care.8–10 However, these technologies are not feasible in newborn infants. Bland-Altman analysis is the most appropriate statistical method for comparing cardiac output measurements using two different technologies.11 Correlation and regression analysis are not sufficient for this purpose. With Bland-Altman analysis, the difference between the two methods (bias) is plotted against their mean. The accuracy is expressed as the mean bias, while precision is defined as the limits of agreement (LOA). The LOA can be calculated from the standard deviation (SD) of the mean bias (LOA = ±1.96 × SD). The LOA provides us with a range of the difference in cardiac output between two methods for 95% of the study population. It is recommended to express both accuracy and precision as a percentage of mean cardiac output instead of an absolute value.12 Bias percentage (bias%) is defined as the mean bias divided by mean cardiac output multiplied by 100 (%), while the error percentage (error%) is calculated as 100% × LOA/mean cardiac output. The difference between accuracy and precision is further explained in Figure 12.1.13 For acceptance of a new technology, the accuracy (bias%) and precision (error%) should at least be comparable with the reference method. This stresses the importance of the use of a valid, and preferably gold-standard, technique for reference. A new technology is generally accepted when the error% is ±30% or less.12 However, this cutoff value is based on the assumption that the precision of the reference method is ±10% to 20% with the acceptance of a new technology when the error% is no more than ±20%. When using a reference method with an error% of more than 20%, the cutoff value for acceptance of the tested technique should be adjusted.12,13 The combined error% can be calculated using the following formula: where error%COMP+REF is the combined error%, error%COMP is the error% of the comparator (new method), and error%REF is the error% of the reference method. The resultant error percentage as a function of the error percentage of the tested method (comparator) and the reference method, respectively, is displayed as an error-gram, as shown in Figure 12.2.12 In addition, the agreement in monitoring temporal changes in cardiac output (trending ability) should be studied by analysis of four-quadrant plots and polar plot methodology.14–16 In a concordance plot the changes in cardiac output, assessed with the comparator (ΔCOCOMP), are plotted against the changes in cardiac output, assessed with the reference method (ΔCOREF). When the changes in cardiac output are in the same direction within the two methods, these changes are concordant. Discordant measurements occur when the changes in one method are in the opposite direction of the other technology. The concordance rate is calculated as the number of concordant measurements divided by the total number of measurements (concordant plus discordant). A concordance rate of >95% is considered good, 90–95% marginal, and <90% poor trending ability.14 Polar plot analysis considers not only the direction but also the magnitude of temporal changes in cardiac output. In a polar plot each data point (ΔCOREF vs ΔCOCOMP) is determined by an angle (the direction of change) and a radius (the magnitude of change). This enables the calculation of: This chapter will provide an overview of all available technologies for the assessment of cardiac output, with emphasis on their applicability in (preterm) newborn infants. A summary of the characteristics, advantages, and limitations of each method is presented in Table 12.1. When available, the results of neonatal validation studies are shown in tables within the appropriate paragraphs. Methods using the Fick principle might utilize the direct Fick method or one of its modifications to render the technique more clinically applicable. However, the modifications often come at the expense of accuracy. In 1870 German physiologist Adolf Eugen Fick stated that the volume of blood flow in a given period (cardiac output) equals the amount of a substance entering the bloodstream in the same period divided by the difference in concentrations of the substance upstream and downstream, respectively.17 Determination of cardiac output according to the original or direct Fick method requires the application of a face mask (or some means of assessing oxygen consumption) and consideration of arterial and venous oxygen concentration, which is usually obtained by taking blood samples for laboratory analysis. The direct Fick method employing a measurement of pulmonary oxygen uptake (discussed later) is considered the gold standard for assessing cardiac output, despite several disadvantages. It is of note though that recent advances in magnetic resonance imaging (MRI) technology have initiated a shift in our thinking; specifically, MRI-derived estimates of cardiac output measurement are now considered by many experts as the gold standard for the measurement of cardiac output. However, MRI-based cardiac output measurement is only feasible in stable patients who are fit enough to undergo MRI scanning (see Chapter 13). According to the direct Fick principle, cardiac output is calculated by dividing oxygen consumption (VO2) by the difference in the oxygen content of the aortic blood (CaO2) and the mixed venous blood (CmvO2). The applicability in its original form, measuring VO2 instead of assuming it, is limited by the fact that in non-intubated patients a face mask must be used. With respect to the application in neonates, a further limitation is that multiple and multisite blood sampling is required. With oxygen being the substance for this method, the Fick principle states that during steady state, oxygen uptake in the pulmonary system equals the oxygen consumption in the tissues (Figure 12.3). Cardiac output (pulmonary blood flow) can be calculated by dividing the pulmonary oxygen uptake by the oxygen concentration gradient (difference) between arterial blood (CaO2) and CmvO2. Under steady-state condition, tissue oxygen consumption is equal to pulmonary oxygen uptake (VO2). Hence where CO is the cardiac output in L/min, VO2 is pulmonary oxygen uptake in mL O2/min, CaO2 is oxygen concentration of arterial blood in mL O2/L, and CmvO2 is oxygen concentration of mixed venous blood (preferably determined in the pulmonary artery) in mL O2/L. Pediatric and adult patients differ in oxygen consumption. Cardiac index is 30–60% higher in neonates and infants to help meet their increased oxygen consumption. Fetal hemoglobin is present in decreasing concentration up to 3–6 months following birth, has higher oxygen affinity, and thus does not deliver oxygen to the tissues as effectively as does adult hemoglobin, when arterial oxygen saturation increases from the fetal levels of 75% in the ascending aorta to 98–100% after birth. In neonates the combination of a higher hemoglobin concentration (16–19 g/dL compared with 13.5–17.5 g/dL in men and 12–16 g/dL in women), higher blood volume per kilogram of body weight, and increased cardiac output compensate for the decreased release of oxygen from hemoglobin to the tissues. Pulmonary oxygen uptake (VO2), or oxygen consumption, can be measured via a Douglas bag, by mass spectrometry, spirometry, or metabolic monitors (indirect calorimetry).18 Table 12.2 depicts VO2 measurements obtained in different patient populations and under different clinical conditions.19–22 Instead of actually measuring VO2, this can also be estimated with the use of different regression equations.23,24 However, the estimation of VO2, which is also referred to as the indirect Fick method, is subject to errors in the determination of cardiac output potentially exceeding 50%. Because of the potential errors and its questionable adaptability to neonates, the cardiac output obtained by the indirect Fick method may be used in neonates for orientation purposes only. Pulmonary oxygen uptake in adults, healthy term newborns, neonates with sepsis, mechanically ventilated preterm neonates, and preterm and term neonates before and after feeding.19–21 See text for details. Oxygen concentration (cO2) is calculated by determining hemoglobin concentration (Hb) and oxygen saturation (sO2), which traditionally is obtained by blood gas analysis: where Hb is hemoglobin in g/dL, sO2 is oxygen saturation as gradient, 1.36 is the oxygen binding capacity of hemoglobin in mL O2/g, 0.0032 is the solubility coefficient of oxygen in mL O2/mmHg, and pO2 is the partial pressure of oxygen in mmHg. Note that the aforementioned equation obtains oxygen content (cO2) in mL O2/dL. To obtain oxygen concentration (cO2) in mL O2/L, one needs to multiply the result by 10 (1 L = 10 dL). Because dissolved oxygen contributes very little to the total oxygen-carrying capacity in the normal range of pO2, oxygen content can be approximated by and the gradient by where Hb is hemoglobin in g/dL, SaO2 is arterial (pulmonary vein) oxygen saturation as gradient, and SmvO2 is mixed venous (pulmonary artery) oxygen saturation as gradient. Alternative to blood gas analysis, SaO2 and SvO2 may be obtained via catheters (e.g., Opticath catheter in combination with Oximetric-3 monitors, Abbott Critical Care Systems, Abbott Laboratories, Abbott Park, Illinois). The limitation is, however, that not mixed venous but central venous blood is sampled, and these are not interchangeable regarding oxygen saturation or oxygen content. Arterial oxygen saturation (SaO2) may be approximated noninvasively by SpO2 obtained via pulse oximetry. Assuming a neonate with VO2 of 7 mL O2/min/kg, Hb of 17 g/dL, SaO2 of 99%, and SmvO2 of 75%, With VO2 normalized for weight, the cardiac output is According to this calculation, cardiac output is 126 mL/kg/min in a neonate under physiologic circumstances. In a study by Tibby and colleagues, in five neonates with birth weights of 3.2 kg or less, the median CO following surgical correction of their congenital heart disease was 138 mL/kg/min.8 However, CO measured by echocardiography in neonates averages around 200 mL/kg/min. There are several reasons why our calculation suggests lower cardiac output compared with the CO assessed by echocardiography. While the Hb concentration assumed in the equation is normal for term neonates in the transitional period, it is likely too high for neonates who underwent cardiac catheterization for clinical reasons and had their CO determined using the Fick principle. In these patients oxygen consumption is also likely to be higher than that of a healthy term neonate. In addition, the methods using the direct Fick principle yield a lower CO compared with that assessed by echocardiography because of the physiologic shunting (approximately 20%) present in the lungs. Indeed, if we change the Hb concentration and the VO2 to 15 g/dL and 8 mL O2/min/kg, respectively, and add 20% to compensate for the physiologic shunting in the lungs, we get a CO of 196 mL/kg/min, which is the same as the estimated 200 mL/kg/min of average CO determined by echocardiography. With the CO2-Fick method, instead of using oxygen as a marker, the exchange of carbon dioxide may be used. This principle is used in the modified carbon dioxide Fick method (mCO2F) and the carbon dioxide rebreathing technology (CO2R). The mCO2F is based on the principle that steady-state carbon dioxide production in the tissue is equal to pulmonary carbon dioxide exchange (VCO2): where CO is the cardiac output in L/min, VCO2 is the pulmonary carbon dioxide exchange in mL CO2/min, CaCO2 is the carbon dioxide concentration in arterial blood in mL CO2/min, and CvCO2 is the carbon dioxide concentration of venous blood (preferably determined in the pulmonary artery), measured in mL CO2/L. Pulmonary carbon dioxide exchange (VCO2) may be measured using volumetric capnography. In a ventilated patient VCO2 can be determined by analysis of the expiratory airflow (Qexp) and carbon dioxide fraction in the expiratory air (FeCO2): where Qexp is expiratory airflow in L/min, FeCO2 is carbon dioxide fraction in expiratory air in mL CO2/L, and T is time in minutes. Carbon dioxide in an arterial or venous blood sample (CbCO2) can be measured by the Douglas equation.25 The amount of both pulmonary CO2 exchange and systemic CO2 production must be converted to standard temperature pressure, dry conditions. This method has been validated in an animal model, and the site of venous blood sampling has been shown to be of minor importance.26 Interestingly, the presence of a significant left-to-right shunt through an artificial ductus arteriosus did not influence the accuracy of the mCO2F method in another study using a juvenile animal model.27 No studies in newborn infants have been published, probably related to the limitation of the need for frequent and multisite blood sampling. In the rebreathing method mixed venous CO2 concentration is estimated from exhaled gas and in this way obviates the need for direct measurement. The change in CO2 exchange and resultant change in arterial CO2 concentration secondary to an end-expiratory hold or addition of dead space is used in the CO2-Fick equation: where QPCBF is the pulmonary capillary blood flow in L/min, VCO2 is the pulmonary carbon dioxide exchange in mL CO2/min, n denotes normal situation, r denotes rebreathing, CaCO2 is the carbon dioxide concentration in arterial blood in mL CO2/min, and CmvCO2 is the carbon dioxide concentration of mixed venous blood in ml CO2/L. Pulmonary blood flow is considered constant during the measurements. Another assumption is that CmvCO2 is not significantly changed throughout the period of rebreathing and nonrebreathing, implying that Therefore where ΔVCO2 denotes the change in pulmonary CO2 exchange and ΔCaCO2 the change in arterial carbon dioxide concentration. Pulmonary capillary blood flow only yields an estimate of the non-shunted blood flow participating in gas exchange. The blood bypassing the lung (shunted blood flow) may be estimated and added to QPCBF to determine overall cardiac output as follows28: Moreover, it is not the change in CaCO2 that is measured in clinical practice, but the change in the partial pressure of carbon dioxide (pCO2) at the endotracheal tube, assuming that endotracheal ΔpCO2, alveolar ΔpCO2, and arterial ΔCaCO2 are interchangeable. This may lead to errors in cardiac output calculation, especially in situations with large dead space ventilation. The NICO system (Philips Respironics, Pittsburgh, Pennsylvania) is an example of a monitor incorporating the carbon dioxide rebreathing method. However, this device is not feasible in small children because of the large dead space of the rebreathing valve. In newborn infants, particularly in premature infants, partial rebreathing is contraindicated, since the technology is based on changes in arterial carbon dioxide concentrations causing significant changes in cerebral blood flow. Indeed, significant alterations in PaCO2 have been shown to be associated with an increased risk of intraventricular hemorrhage, periventricular leukomalacia, and impaired neurodevelopmental outcome (see Chapters 1, 2, and 7).29–31 In 1761 Haller reported a new methodology to measure pulmonary circulation time with the use of a colored dye in an animal model.32 This principle was adopted and modified initially by Stewart33,34 and later by Hamilton,35,36 and it’s now known as the indicator dilution technique. An indicator dilution curve can be obtained by measuring the change in time of the concentration of a known quantity of indicator that is injected proximal to the point of measurement. With the use of the Stewart-Hamilton equation, blood flow (cardiac output) can be derived from the dilution curve:
Chapter 12: Assessment of cardiac output in neonates: Techniques using the fick principle, indicator dilution technology, doppler ultrasound, electrical biosensing technology, and arterial pulse contour analysis
Introduction
The importance of validation
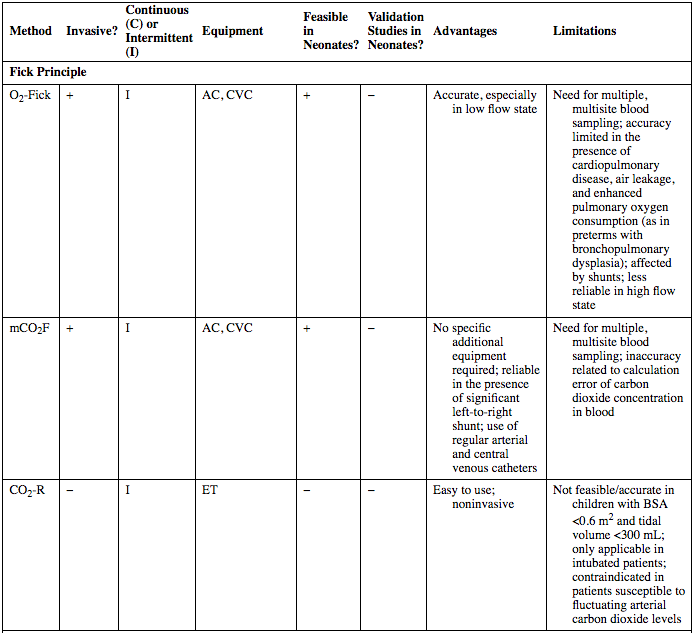

Method
Invasive?
Continuous (C) or Intermittent (I)
Equipment
Feasible in Neonates?
Validation Studies in Neonates?
Advantages
Limitations
Fick Principle
O2-Fick
+
I
AC, CVC
+
−
Accurate, especially in low flow state
Need for multiple, multisite blood sampling; accuracy limited in the presence of cardiopulmonary disease, air leakage, and enhanced pulmonary oxygen consumption (as in preterms with bronchopulmonary dysplasia); affected by shunts; less reliable in high flow state
mCO2F
+
I
AC, CVC
+
−
No specific additional equipment required; reliable in the presence of significant left-to-right shunt; use of regular arterial and central venous catheters
Need for multiple, multisite blood sampling; inaccuracy related to calculation error of carbon dioxide concentration in blood
CO2-R
−
I
ET
−
−
Easy to use; noninvasive
Not feasible/accurate in children with BSA <0.6 m2 and tidal volume <300 mL; only applicable in intubated patients; contraindicated in patients susceptible to fluctuating arterial carbon dioxide levels
Indicator Dilution
PATD
+++
I (& C)
PAC
−
−
Clinical gold standard of cardiac output monitoring in adults; ancillary hemodynamic variables provided
Very invasive; not feasible in small children; relatively high complication rate; transient bradycardia in response to fast injection of cold saline; results affected by shunt
TPTD
++
I (& C)
Dedicated AC, CVC
−
−
Clinical gold standard in pediatric patients; continuous monitoring when used to calibrate APCA; ancillary hemodynamic variables provided; reliable in presence of significant LtR-shunt
Dedicated thermistor-tipped arterial catheter required; catheterization of femoral, brachial, or axillary artery needed; repetitive measurements affect fluid balance
TPLiD
++
I (& C)
AC, CVC
−
−
Regular catheters used; continuous monitoring when used to calibrate APCA; ancillary hemodynamic variables provided
Lithium toxicity; need to withdraw blood; limited repeated measurements possible; not compatible with non-depolarizing muscle relaxants; influenced by hyponatremia; results affected by shunts
TPUD
++
I (& C)
AC, CVC
+
−
Nontoxic indicator; small indicator volume; ancillary hemodynamic variables provided; safe with regard to cerebral and systemic oxygenation and circulation; reliable in presence of significant LtR-shunt or heterogeneous lung injury
Repetitive measurements affect fluid balance; necessity to use extracorporeal loop
PDD
+
I
CVC
+
−
Noninvasive detection of indocyanine green; intravascular volume measurement possible
Limited repeated measurements possible; inaccuracy due to poor peripheral perfusion, motion artifact, or excess light; rarely side effects; difficulty in the acquisition of reliable pulse waveforms in small children and newborns
Doppler Ultrasound
TEE
+
I
Esophageal probe
±
−
Less invasive; evaluation of cardiac function and structure
Significant training required; highly operator dependent; inaccuracy due to errors in the calculation of velocity time integral, cross-sectional area and angle of insonation; not feasible in infants <3 kg; small risk of complications; not tolerated by conscious patients
TED
+
I
Esophageal probe
±
−
Less invasive; continuous monitoring
Inaccuracy due to errors in the calculation of velocity time integral, cross-sectional area, and angle of insonation; not feasible in infants <3 kg; small risk of complications; not tolerated by conscious patients
TCD
−
I
External probe
+
+
Noninvasive; easy to use
Blind aiming of transducer for signal acquisition; error due to insonation angle deviation; no real measurement of cross-sectional area of outflow tract; large interobserver variability; questionable accuracy and precision
TTE
−
I
Echocardiograph
+
+
Noninvasive; evaluation in detail of cardiac function and structure; additional information about potential intra- and extracardiac shunting; most used method of cardiac output monitoring in neonatal clinical care
Significant training required; highly operator dependent; not an easy, bedside method; high intra- and interobserver variability; inaccuracy due to errors in the calculation of velocity time integral, cross-sectional area, and angle of insonation
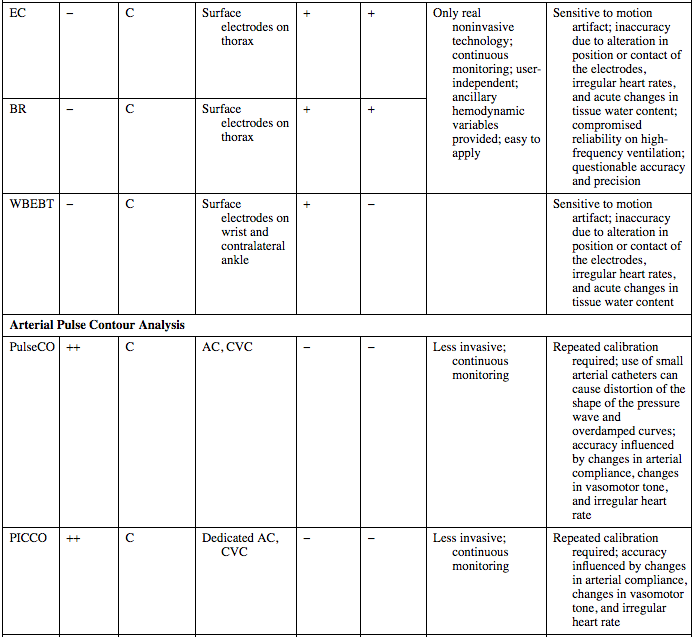
Electrical Biosensing Technology
EC
−
C
Surface electrodes on thorax
+
+
Only real noninvasive technology; continuous monitoring; user-independent; ancillary hemodynamic variables provided; easy to apply
Sensitive to motion artifact; inaccuracy due to alteration in position or contact of the electrodes, irregular heart rates, and acute changes in tissue water content; compromised reliability on high-frequency ventilation; questionable accuracy and precision
BR
−
C
Surface electrodes on thorax
+
+
WBEBT
−
C
Surface electrodes on wrist and contralateral ankle
+
−
Sensitive to motion artifact; inaccuracy due to alteration in position or contact of the electrodes, irregular heart rates, and acute changes in tissue water content
Arterial Pulse Contour Analysis
PulseCO
++
C
AC, CVC
−
−
Less invasive; continuous monitoring
Repeated calibration required; use of small arterial catheters can cause distortion of the shape of the pressure wave and overdamped curves; accuracy influenced by changes in arterial compliance, changes in vasomotor tone, and irregular heart rate
PICCO
++
C
Dedicated AC, CVC
−
−
Less invasive; continuous monitoring
Repeated calibration required; accuracy influenced by changes in arterial compliance, changes in vasomotor tone, and irregular heart rate
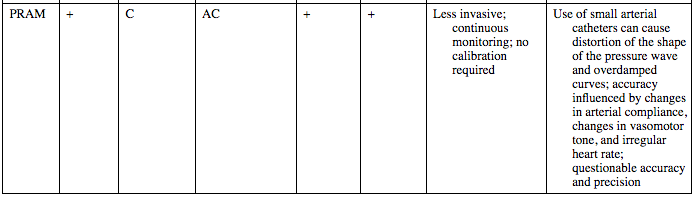
PRAM
+
C
AC
+
+
Less invasive; continuous monitoring; no calibration required
Use of small arterial catheters can cause distortion of the shape of the pressure wave and overdamped curves; accuracy influenced by changes in arterial compliance, changes in vasomotor tone, and irregular heart rate; questionable accuracy and precision
Fick principle
Oxygen fick
Pulmonary oxygen uptake
Group
VO2 (Mean ± SD)
Notes
Adults
125 mL O2/min/m2
Indexed for body surface area
Healthy newborns (Bauer, 2002)20
6.7 ± 0.6 to 7.1 ± 0.4 mL O2/min/kg
Indexed for body weight (n = 7)
Neonates with sepsis (Bauer, 2002)20
7.0 ± 0.3 to 8.2 ± 0.4 mL O2/min/kg
n = 10
Mechanically ventilated preterm infants (Shiao, 2006)21
8.0 ± 3.73 mL O2/min/kg
<8 h after blood drawn (n = 202)
11.3 ± 5.65 mL O2/min/kg
≥8 h after blood drawn (n = 65)
Preterm and term infants before and 1 h after feeding (Stothers and Warner, 1979)19
4.8 mL O2/min/kg (estimated from Figure 6.1)
n = 9 preterm infants
n = 9 term infants
Term infants during sleep22
5.97 mL O2/min/kg during REM sleep
n = 30
5.72 mL O2/min/kg during non-REM sleep
Oxygen concentration gradient
Cardiac output (calculation examples)
Carbon dioxide fick
Modified carbon dioxide fick method
Carbon dioxide rebreathing technology
Indicator dilution techniques
Assessment of cardiac output in neonates: Techniques using the fick principle, indicator dilution technology, doppler ultrasound, electrical biosensing technology, and arterial pulse contour analysis