chapter 3 Assessing Physical Growth and Nutrition
How short is too short? How fat too fat? When is a child really too thin or too tall? Pathologic disturbances of growth are easy enough to recognize when they are extreme. However, most children who are brought to physicians because their parents are concerned about abnormalities of growth or nutrition turn out to be in the “gray areas” of physical growth, that is, at the extremes of the normal distribution curves where normality and abnormality overlap. Thus in many clinical situations, the first problem is to decide whether the child is expressing an extreme of normality or a true abnormality. Three procedures are required for making good clinical decisions:
It is often forgotten that children resemble their parents, not only in their ultimate body configuration but also with respect to the route (trajectory) they travel to attain that final appearance.
Therefore, in children with growth deviations that are possibly constitutional, it is essential to find out what the father and mother looked like at around the same age. Looking at old family photos often helps. These photos may show that the heavyset, 190-cm (6-foot, 3-inch) tall father of an abbreviated, needle-shaped 10-year-old boy was, like his son, the shortest and thinnest person in his class until he was 15 years old, when he underwent a major adolescent growth spurt and bypassed his classmates. Or asking the skinny girl’s plump, anxious mother how much she herself weighed on her wedding day may surprisingly divulge that this 152-cm (60-inch) tall woman who now weighs 66 kg (145 lb) weighed only 43 kg (95 lb) soaking wet at the time of her marriage.
Measurements and Growth Charts
Recumbent length versus height
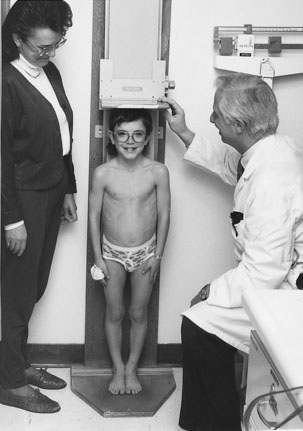
Because most babies younger than 10 to 12 months cannot stand alone and most toddlers refuse to stand still, any child younger than 2 years should be measured for length in the recumbent position. In children of this age group, recumbent length and standing height are not the same, the former being significantly greater. Standard growth charts for younger children are based on measurements of recumbent length. Various accurate measuring devices—some cheap, others more expensive—are available for determining recumbent length and height. The essential point is to use a stable, accurate, fixed device if both individual and serial measurements are to mean anything (Figs. 3-1 and 3-2). Accuracy is a must, but never more so than when there is the slightest concern about the child’s growth. To be absolutely sure, check all measurements at least twice, and never accept anyone else’s measurements as reliable.

FIGURE 3-1 Measuring length: the appropriate method of assessing linear growth in children younger than 2 years. Keeping the youngster entertained improves accuracy.

FIGURE 3-2 Measuring height: The apparatus should be fixed and accurate. The child should be positioned with the head and heels touching the back board.
Finally, never commit the unpardonable sin of eyeball approximation—as, unfortunately, many persons still do. Notoriously unreliable methods for measuring recumbent length include (1) putting pen or pencil marks on a piece of paper on which the baby is lying to approximate the location of the crown and heel and then removing the baby and measuring the distance between the marks, or (2) laying a tape measure beside or under the baby. These disreputable practices result in highly inaccurate measurements and can lead to unreliable charting of growth and misdiagnoses of disproportion between linear and ponderal growth.
Weight
Infants and young children should be weighed naked or wearing a diaper at most, with the weight of the diaper subtracted afterward. The scales should be reliable and should be checked for accuracy and balance before each use. In hospitalized children, weight fluctuations often influence management. Therefore, infants should be weighed at the same time each day, ideally in the morning before being fed and, if possible, always by the same caregiver. Any unusual or unexpected fluctuation calls for reweighing. If a sudden gain or loss of weight is validated, a reasonable explanation (e.g., edema causing a sudden gain or inadequate intake, diuresis, or diarrhea causing a sudden loss) should be sought.
Occasionally, young children resist sitting or standing alone on a scale to be weighed. When that happens, rather than struggling to attain dubious success, have a parent stand on the scale while holding the child in his or her arms. Then weigh the parent alone and determine the child’s weight by subtraction.
Head circumference
The technique for measuring head circumference is described in Chapter 7. Be sure to check the measurement at least once to be certain it is accurate.
Large and Small Heads
By far the most common cause of an unusually large head in an otherwise normal child is having a parent who also has a large head—most often the father. If the father is not present, ask the mother if he has trouble finding a hat that fits him.
When a child’s head circumference is two standard deviations or more above the mean, apply a tape measure to each of the parents’ heads to see where their measurements fit on the chart before creating anxiety or considering further investigation. Once it has been established that having a large head is a familial characteristic and that the affected parent and child are both otherwise normal, no further investigation is necessary. This normal variant goes by the pretentious name benign familial megalencephaly.
Occasionally, below-normal head circumference also is familial and benign (i.e., without associated developmental problems). More often, it is associated with developmental delay, even when it is familial. The usual cause of poor cranial growth is poor brain growth. Much less commonly, poor cranial growth can result from premature fusion of several cranial sutures (a condition known as premature synostosis). If all cranial sutures fuse prematurely, the head circumference will be small and the child eventually may show signs of increased intracranial pressure, such as papilledema and radiographic evidence of increased pressure by the cerebral gyri on the inner table of the skull—an exaggeration of the so-called digital impressions. This condition is quite rare.
More often, premature synostosis involves a single suture or a pair of sutures. This condition may be clinically recognized in two ways:
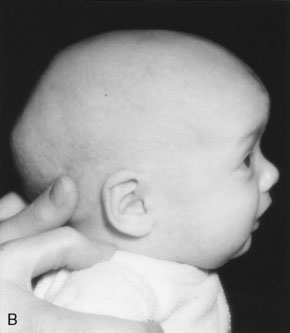
Remember that skull bones grow in a direction perpendicular to the suture lines. The directions in which the skull can and cannot grow after synostosis of a suture are therefore predictable, as is the shape of the resulting cranial distortion. For example, if the sagittal suture fuses prematurely, further lateral growth of the skull is prevented. Anteroposterior growth continues (perpendicular to the coronal sutures), and the skull will become long and narrow (a condition known as dolichocephaly) (Fig. 3-3).
Graphic recording of measurements
The child’s recumbent length or standing height, body weight, and head circumference should be recorded and plotted on appropriate age- and sex-specific growth charts. In North America, the growth charts currently used almost universally are those published in 2000 by the National Center for Health Statistics in collaboration with the National Center for Chronic Disease Prevention and Health Promotion (Fig. 3-4). These charts permit plotting of length-for-age, weight-for-age, and head circumference–for-age measurements along percentile lines, as well as plotting of body mass index (BMI) on a percentile chart.*


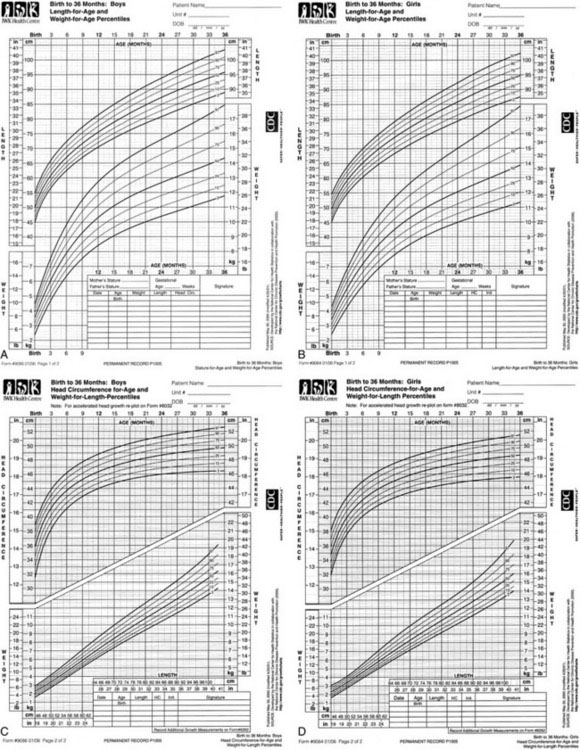
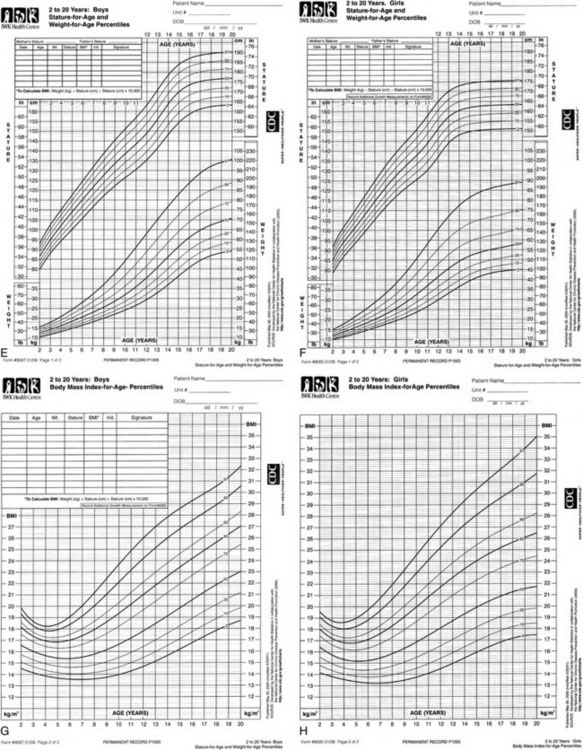
FIGURE 3-4 Growth charts for children from birth to 20 years.
A through D, Sex-specific growth charts for infants (birth to 36 months): length-for-age and weight-for-age percentiles (A and B), and head circumference-for-age and weight-for-length percentiles (C and D). E–H, Sex-specific growth charts for older children (2 to 20 years): stature-for-age and weight-for-age percentiles (E and F), and body mass index-for-age percentiles (G and H).
(Developed by the National Center for Health Statistics in collaboration with the National Center for Chronic Disease Prevention and Health Promotion, 2000; available at http://www.cdc.gov/growthcharts.)
BMI is determined using the following formula:
Mid-parental height
Because the growth potential of a child depends on genetic factors, calculation of the mid-parental height (also referred to as target height) is very useful. Measure the parents yourself if possible. Take the sum of the parents’ heights, add or subtract 13 cm for boys or girls, respectively, and divide by 2 to get the mid-parental height. The child’s growth would be expected to be tracking to an adult height that is within two standard deviations or ±9 cm of this number. Often, showing parents that the child’s growth fits with the family pattern will allay their concerns about their child’s height.
Special growth charts have been developed for children with certain dysmorphic conditions, including Down syndrome, Turner syndrome, and achondroplasia (see Recommended Reading).
Proportion and disproportion
When a child seems unusually short, first determine whether the growth retardation is proportional or disproportional—that is, whether there is significant disproportion between the growth of the head, trunk, and extremities. The chondrodysplasias, of which the best recognized is achondroplasia, are characterized by shortening of the limbs with normal linear growth of the trunk. Thus the achondroplastic child (terms such as dwarf and midget should never be used, because they have very disturbing connotations for parents) has a normal sitting height but a markedly reduced standing height.
Arm span and its relationships
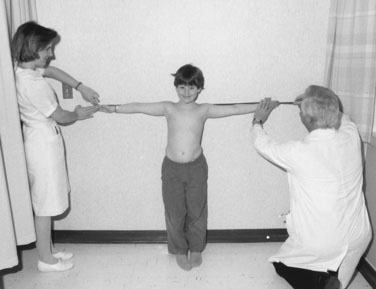
If a child is old enough to cooperate, you can measure the arm span by having the youngster stand with the back and heels touching the wall and the arms fully extended parallel to the floor, with the palms facing forward. With parental assistance and using a steel tape measure, measure the distance between the third fingers of each hand. The span-height difference and span-to-height ratio then can be determined (Fig. 3-5).
Measuring the upper and lower segments
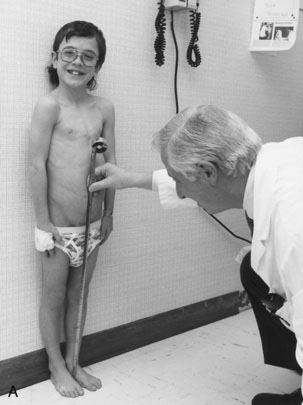
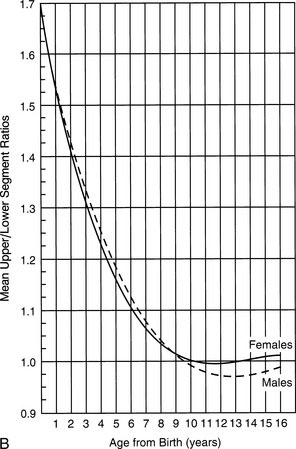
Measuring a child’s upper and lower segments is tricky and is not always supremely accurate. Obtaining these measurements requires identifying the top of the pubic ramus and marking it on the skin with a pen or wax pencil. This procedure sounds easier than it is, especially in a chubby youngster, in whom you must indent the adipose lower abdominal-suprapubic area to locate the top of the pubic bone. After you make the mark and release the pressure, the abdominal wall springs back and the mark does not always stay where you thought it was relative to the pubis. Make sure the youngster does not bend forward to look, because this movement can distort the measurement. Measure the lower segment by dropping a steel tape perpendicularly from the mark to the floor (Fig. 3-6, A). Then determine the length of the upper segment by subtracting the lower segment length from the height. Part B of Figure 3-6 shows the average upper-to-lower segment ratio at different ages. Remember that there are ethnic and familial differences in these ratios, so it is sometimes necessary to measure the parents as well.


FIGURE 3-6 A, Measuring the lower body segment. Subtract this measurement from the standing height to obtain the upper body segment measurement. B, Upper-to-lower body segment ratio for males and females, birth to 16 years.
(B from Greene MG, editor: The Harriet Lane handbook, 12th ed, St. Louis, Mosby–Year Book, 1991.)
Importance of sequential measurements
A single measurement can establish whether the growth attained is in the normal range but does not reveal the past or predict the future.
When growth deviates from normal standards, sequential measurements over significant periods are needed to evaluate the underlying problem adequately and, when necessary, to monitor the response to treatment. The older the child, the longer the measurement interval that is required to assess the significance of any apparent deviation in growth. Measurement of growth velocity, as described later in this chapter, can be more informative than “snapshot” anthropometric measurements taken at a particular moment in time.
Regular charting of height and weight should be part of every child’s routine health care. Parents should be encouraged to keep their own records of these measurements. During the first year of life, it is not unusual for a child’s height and weight measurements to cross at least one percentile line. After 18 months to 2 years of age, however, measurements in most healthy children tend to stay within the same percentile channel (or an adjacent channel) until the onset of puberty, unless obesity develops or some form of significant growth delay occurs.
Once normal head circumference has been established in infancy, it is usually unnecessary to continue measuring the head circumference regularly unless this is specifically indicated (e.g., by the presence of a neurologic or developmental problem).
Useful as they are, growth charts are no substitute for good judgment. Children march to individual drummers and often follow the growth timetables and growth trajectories of their antecedents. Remember that the curves on published growth charts are smoothed-out representations of observations of many healthy youngsters. Individual children, not having read this textbook, may not follow such idealized curves precisely, because their growth may occur in irregular spurts.
When you find any deviation from these “normal” curves, ask yourself what that deviation actually means in terms of the child’s genetic, medical, and psychosocial history and current health status. Whenever possible, use growth charts derived from the same geographic area or ethnic population as that of the child under consideration. For example, many Southeast Asian children have heights and weights below the third percentiles of North American growth charts. These differences may reflect a mixture of ethnic (genetic) and nutritional (environmental) factors. When the economy of a region improves dramatically over a few years, average heights and weights of children can increase remarkably. In fact, average height for age in a particular population over time is a telling measure of the health of a nation’s economy.
A Language for Communicating Information About Children’s Growth
From time to time, a child is described as being “below the third percentile for height and weight.” That popular style of description is an abomination and a curse. In the first place, by definition, 3% of the normal population rightfully belongs below the third percentile of any growth parameter. This placement does not automatically categorize them as abnormal. Also, such phrasing tells us absolutely nothing about (1) how far below the third percentile the measurements fall and (2) whether the child’s linear and ponderal growth are impaired proportionally or disproportionally.
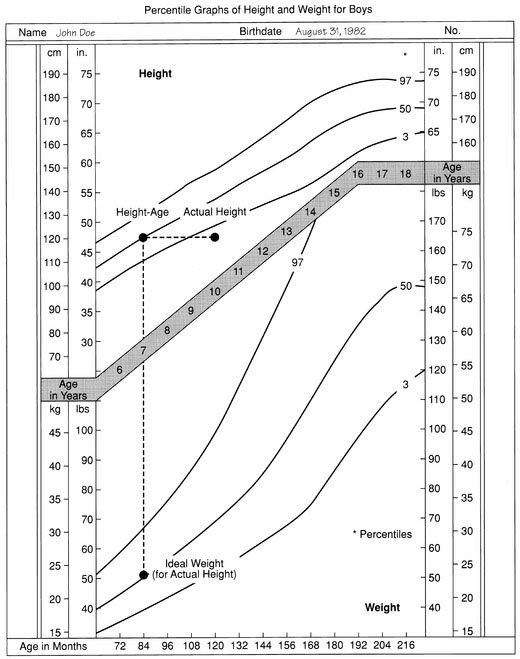
Several ways of expressing growth measurements are more meaningful and useful. One is to determine the child’s “height-age” or “weight-age” (i.e., the age for which a particular measurement represents the 50th percentile on a standard growth chart) (Fig. 3-7). Figure 3-7 shows that the boy in question, whose chronologic age is 10 years 4 months, has a height-age of 7 years and a weight-age of 5 years 2 months. Stating each measurement in these terms immediately communicates the image of a child who is a little shorter than average but is also underweight or undernourished, even in relation to his reduced height.

Stay updated, free articles. Join our Telegram channel

Full access? Get Clinical Tree

