Fig. 6.1
A necrotic osteoblastic osteosarcoma post-chemotherapy can be observed in the border next to the physis (H&E, ×200)
Physeal invasion was observed in 13 of the 38 resection specimens (34 %). Note that in all of these cases, on the basis of imaging the occurrence of physeal invasion had been considered to be uncertain. Of the 19 cases in Group I, 12 showed physeal invasion (63 %). There was one case (5 %) of physeal invasion in Group II. In the rest of the cases of Group I, tumors had a large contact area with the physis and had eroded it to some degree, but there was no demonstrable invasion. In Group II, most of the tumors were located at some distance from the physis; in two cases the tumors were close: at 3 mm and 5 mm from it; and in a further two cases the tumors were in contact with the growth plate, one of them with a large base of contact area but without invasion.
The average age at the time of tumor resection was 14.5 years for patients with epiphyseal involvement but 12.5 for patients without.
With regard to pathological findings, we observed the following three morphological growth patterns of tumor in relationship with the physis.
1.
In 18 cases (47 %), between the tumor and the physis, there was a metaphyseal band of variable width (3–10 mm) within which there was no detectable neoplastic disease. Macroscopically, it was clear that the tumor was at a distance from the growth plate. In these cases, magnetic resonance images also indicated that the tumor was separate from the physis (Fig. 6.2). This disease-free metaphyseal zone had increased vascularization, which consisted of ectatic capillaries, and numerous osteoclastic cells flanking bone trabeculae, whose surfaces appeared undulate (Figs. 6.3 and 6.4). In these areas, there was often pronounced VEGF expression in both osteoblasts and osteoclasts (Fig. 6.5).
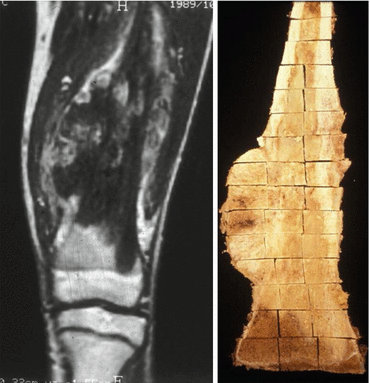
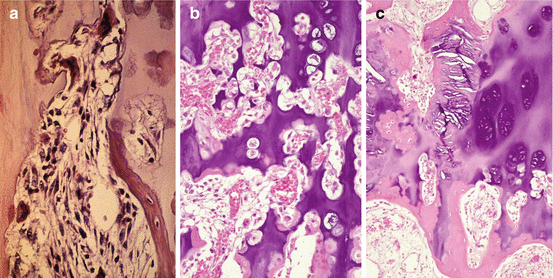
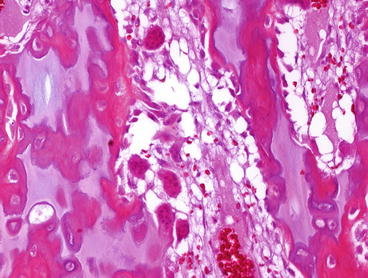
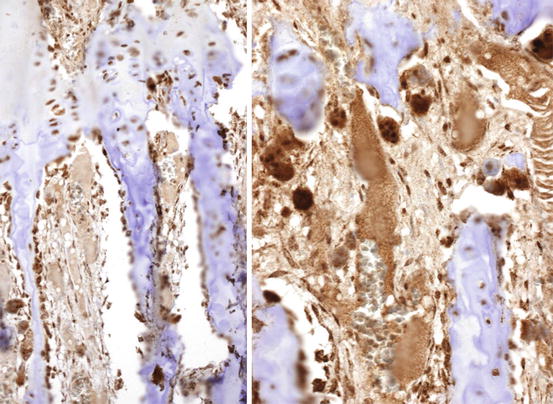

Fig. 6.2
Left MRI of an osteosarcoma that is apparently close to the physis. Right Macroscopically, an osteoblastic osteosarcoma that is destroying cortical bone and invading the medullar bone. The tumor is located several millimeters away from the growth plate

Fig. 6.3
(a–c) Osteoclastic activation accompanying fibrovascular proliferation in the femoral physis of a 10-year-old patient affected by osteosarcoma. The front edge of the tumor extends upwards to within 4 mm of the physis, which remains un-invaded (H&E, ×200)

Fig. 6.4
A number of osteoclasts and osteoblasts are seen in the bone trabeculae in the growth plate. The osteoblasts have a hypertrophic aspect (H&E, ×200)

Fig. 6.5
A strong immunoreactivity against VEGF can be observed in the osteoclasts and osteoblasts in the physis. A high density of vessels can be distinguished (Immunohistochemistry, ×200)
2.
In eight cases (21 %) the tumor was in contact with the physis on the metaphyseal side. This contact without invasion was also suggested by MRI (Figs. 6.6 and 6.7). In the zone of contact, the physis appeared uniformly thinned, the hypertrophic and calcification zones having practically disappeared. To confirm non-invasion, a larger tissue sampling was obtained from these patients, but in no case was tumor observed in the epiphysis.
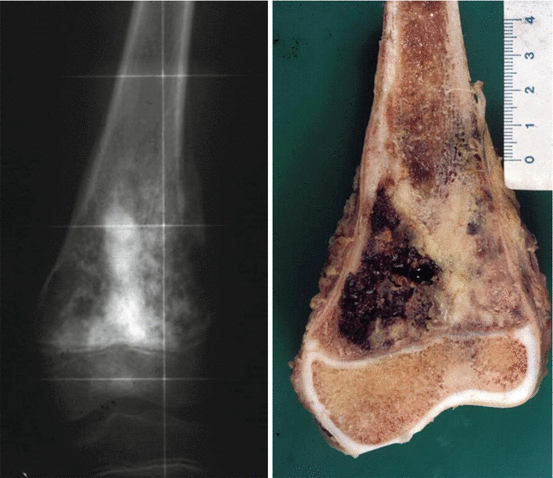
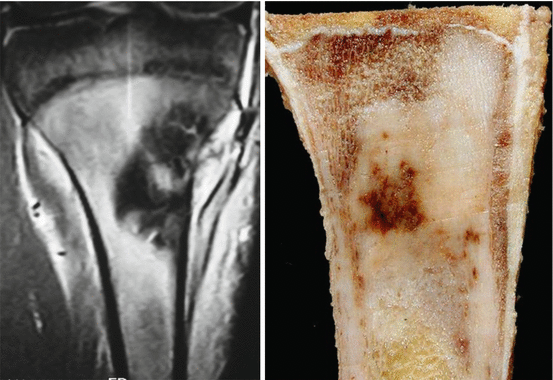

Fig 6.6
Left Radiography of a femoral osteosarcoma that shows that the tumor is in contact with the growth plate. Right An osteoblastic osteosarcoma in extensive contact with the physis; the histological study determined unequivocally that the tumor had not invaded the physis

Fig. 6.7
Left In the MRI this tibial osteosarcoma seems to be in contact with the growth plate. Right However, macroscopically this osteoblastic osteosarcoma is found to be at a distance of 1 mm from the growth plate
3.
Get Clinical Tree app for offline access

The third morphological picture was seen in the remaining 13 cases (32 %), where epiphyseal tumor invasion was observed. Macroscopically, the tumor was seen to be within the epiphysis, and this observation was corroborated by examination of the histological section (Fig. 6.8). Morphologically there were two patterns of physeal invasion. In the first pattern, epiphyseal areas were in close contact with the tumor but not completely invaded by it: tumor cells could be seen permeating the spaces between cartilaginous matrix columns next to dilated capillaries (Fig. 6.9). In the second pattern, in addition to the changes indicated above, there was perforation and thinning of the growth cartilage. The perforation was multi-focal, leaving dispersed islands of highly disorganized cartilage within the tumor tissue (Fig. 6.10). In general, the extensions of tumor into the epiphysis appeared to have expanded evenly (Fig. 6.11). Some sections revealed paradoxical areas in which neoplastic tissue appeared on both sides of uncompromised growth cartilage; the apparent lack of connection can be explained by supposing that the plane of section did not cross the area of physeal involvement by the tumor (Fig. 6.12).
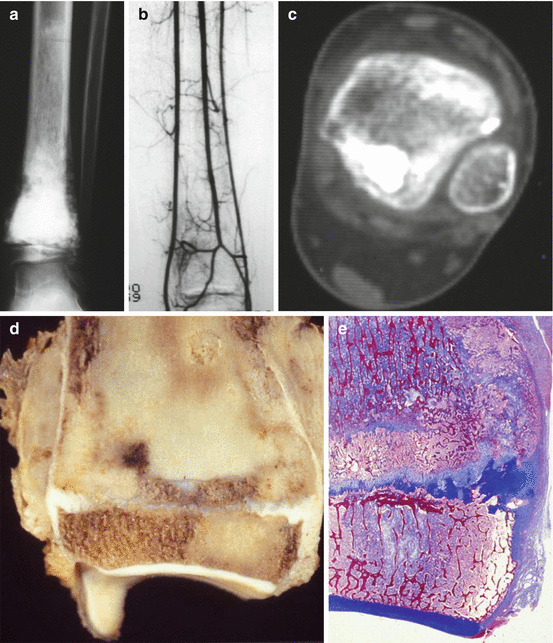
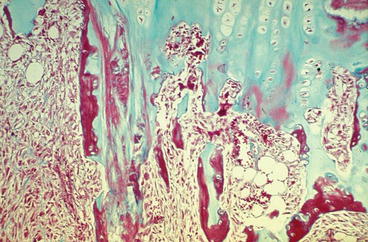
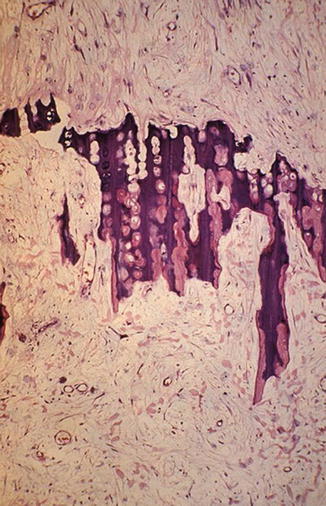

Fig. 6.8
(a–c) Left Osteosarcoma in the distal tibia. Angiography and CT scan showed invasion of the epiphysis. (Note that in the 1980s, MR imaging was not available). (d, e) This osteosarcoma is eroding the growth plate and invading the physis. In the histological cut stained with Masson trichrome, the osteoblastic osteosarcoma is clearly located in the epiphysis, but the location of physis invasion is not observed in this section

Fig. 6.9
Physeal invasion by an osteosarcoma in a 12-year-old boy. Tumor cells infiltrate as finger-like growths permeating the calcification and hypertrophic zones of the physeal cartilage (Masson’s trichrome, ×40)

Fig. 6.10


The remains of physeal cartilage in the femur of an 8-year-old girl with metaphyseal osteoblastic osteosarcoma. The patient had received chemotherapy before resection of the tumor. Several islands of physeal cartilage can be seen surrounded by reparative tissue which occupies the whole thickness of the physis. This organization of tissue has substituted the necrotic tumor (H&E, ×100)
Stay updated, free articles. Join our Telegram channel

Full access? Get Clinical Tree


